Unlock a world of possibilities! Login now and discover the exclusive benefits awaiting you.
- Qlik Community
- :
- All Forums
- :
- QlikView App Dev
- :
- Gauge Chart Question
- Subscribe to RSS Feed
- Mark Topic as New
- Mark Topic as Read
- Float this Topic for Current User
- Bookmark
- Subscribe
- Mute
- Printer Friendly Page
- Mark as New
- Bookmark
- Subscribe
- Mute
- Subscribe to RSS Feed
- Permalink
- Report Inappropriate Content
Gauge Chart Question
Hi Experts,
I'm new in Qlikview and im trying to figure out the gauge chart.
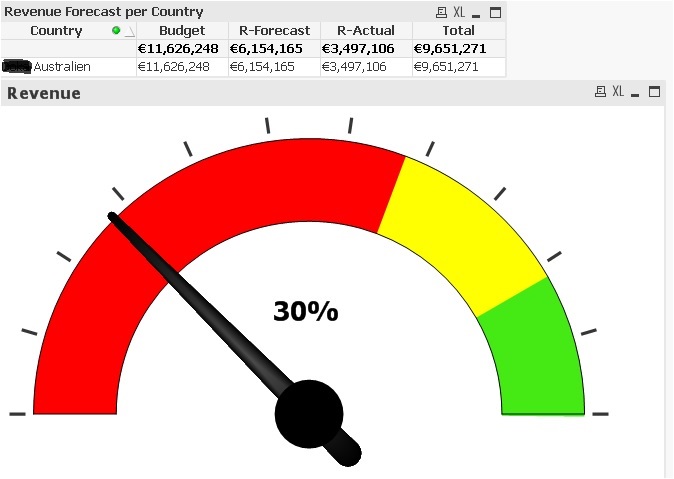
What i wanted is to have 3 segments,
1st segment - 0 to forecast of countries (Red)
2nd segment - forecast of countries to budget (Yellow)
3rd segment - Budget of countries to budget of countries+12% (Green)
My segment set up are
Segment 1 - "0"
Segment 2 - "=sum([revenue forecast])"
Segment 3 - "=sum(Budget)"
My expression is - "sum(Revenue)"
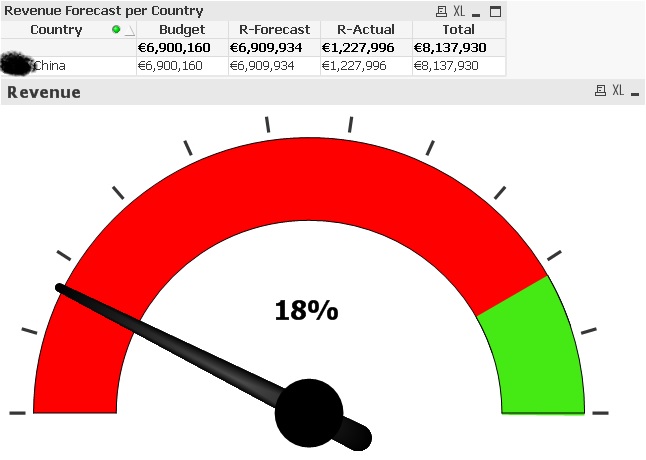
But my problem is if the forecast exceed that budget the 1st and 2nd segment turns into red. below is the example
Australia - since there Forecast is below the budget then it shows the correct gauge chart.
For china since there forecast exceeds the budget most of it turns into red. how can i fix this issue?
Hope you guys can help me out.
Thanks,
Romer
- Mark as New
- Bookmark
- Subscribe
- Mute
- Subscribe to RSS Feed
- Permalink
- Report Inappropriate Content
I think you need to define in segments please find attached collections for Gauges may help you.
Vikas
If the issue is solved please mark the answer with Accept as Solution & like it.
If you want to go quickly, go alone. If you want to go far, go together.
- Mark as New
- Bookmark
- Subscribe
- Mute
- Subscribe to RSS Feed
- Permalink
- Report Inappropriate Content
Hi Vikash,
Thank you very much for the demo document. Unfortunately I am unable to open the file.
- Mark as New
- Bookmark
- Subscribe
- Mute
- Subscribe to RSS Feed
- Permalink
- Report Inappropriate Content
what error you are getting ? or do you have PE
Vikas 
If the issue is solved please mark the answer with Accept as Solution & like it.
If you want to go quickly, go alone. If you want to go far, go together.
- Mark as New
- Bookmark
- Subscribe
- Mute
- Subscribe to RSS Feed
- Permalink
- Report Inappropriate Content
Hi vikasmahajan
Yes i have a PE. I think my segment setup lower bound is wrong for Segment 1 and 2.