Unlock a world of possibilities! Login now and discover the exclusive benefits awaiting you.
- Qlik Community
- :
- All Forums
- :
- QlikView App Dev
- :
- Gauge Chart
- Subscribe to RSS Feed
- Mark Topic as New
- Mark Topic as Read
- Float this Topic for Current User
- Bookmark
- Subscribe
- Mute
- Printer Friendly Page
- Mark as New
- Bookmark
- Subscribe
- Mute
- Subscribe to RSS Feed
- Permalink
- Report Inappropriate Content
Gauge Chart
Hi All,
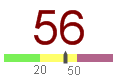
Here is the value 56. If Value is <20 scale should be in Green and values is in between 20 and 50 it should be Yellow.
How can we get the value. If >50 scale should be ini Red color.
How to solve this one. Can any one explain please this one. Thanks in advance.
- Mark as New
- Bookmark
- Subscribe
- Mute
- Subscribe to RSS Feed
- Permalink
- Report Inappropriate Content
You can assign this for slider expression as
If this is an percentage
If(sum(value) < 0.2, green(),
If(sum(value) > 0.2 and sum(value) <0.5, yellow(), red()))
If it is number
If(sum(value) < 20, green(),
If(sum(value) > 20 and sum(value) <50, yellow(), red()))
- Mark as New
- Bookmark
- Subscribe
- Mute
- Subscribe to RSS Feed
- Permalink
- Report Inappropriate Content
The color split of the bar is set standard equal: each of your 3 colors fills 33% of the bar.
You can alter the lower bound of each segment in the chart properties - presentation - segment setup
yellow lower bound = 20 (or as Anil Babu replied: 0.2 if you're using percentage)
red lower bound 50 (or 0.5 for %)
- Mark as New
- Bookmark
- Subscribe
- Mute
- Subscribe to RSS Feed
- Permalink
- Report Inappropriate Content
Thanks Anil. Its working.
- Mark as New
- Bookmark
- Subscribe
- Mute
- Subscribe to RSS Feed
- Permalink
- Report Inappropriate Content
Glad we were able to offer you, Please close this thread by flag "Correct Answer" using Qlik Community Tip: Marking Replies as Correct or Helpful