Unlock a world of possibilities! Login now and discover the exclusive benefits awaiting you.
- Qlik Community
- :
- All Forums
- :
- QlikView App Dev
- :
- Gauge chart - how to
- Subscribe to RSS Feed
- Mark Topic as New
- Mark Topic as Read
- Float this Topic for Current User
- Bookmark
- Subscribe
- Mute
- Printer Friendly Page
- Mark as New
- Bookmark
- Subscribe
- Mute
- Subscribe to RSS Feed
- Permalink
- Report Inappropriate Content
Gauge chart - how to
Hi guys,
I have been asked to create the following chart. Any suggestion will be appreciated.
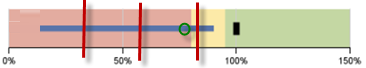
Black dot = Target
Green dot = Actual
Blue line = all sites range
Red vertical lines = Quartiles 25%, 50%, 75%
There is no problem with the gauge, black dot (qv expression) and red vertical lines (qv reference lines).
Is is possible to add another expression for the green circle?
What do you recommend for the blue line?
Thanks,
Aldo.
- Tags:
- gauge_charts
- Mark as New
- Bookmark
- Subscribe
- Mute
- Subscribe to RSS Feed
- Permalink
- Report Inappropriate Content
This extension is close to your requirements.Bullet Chart Extension Redux
- Mark as New
- Bookmark
- Subscribe
- Mute
- Subscribe to RSS Feed
- Permalink
- Report Inappropriate Content
Hi Colin,
Thanks for your answer.
Since we may be working under IE Plug-In, (extensions disabled), I am first looking for a "qlikview native way" to implement it.
Aldo.
- Mark as New
- Bookmark
- Subscribe
- Mute
- Subscribe to RSS Feed
- Permalink
- Report Inappropriate Content
see this examples:
- Mark as New
- Bookmark
- Subscribe
- Mute
- Subscribe to RSS Feed
- Permalink
- Report Inappropriate Content
So you recommend to implement using a bar chart...
may be, need to check.
Thanks!