Unlock a world of possibilities! Login now and discover the exclusive benefits awaiting you.
- Qlik Community
- :
- All Forums
- :
- QlikView App Dev
- :
- Gauge in table
- Subscribe to RSS Feed
- Mark Topic as New
- Mark Topic as Read
- Float this Topic for Current User
- Bookmark
- Subscribe
- Mute
- Printer Friendly Page
- Mark as New
- Bookmark
- Subscribe
- Mute
- Subscribe to RSS Feed
- Permalink
- Report Inappropriate Content
Gauge in table
Hi All,
I have three variables in my model :
Date
Estimate
Actual
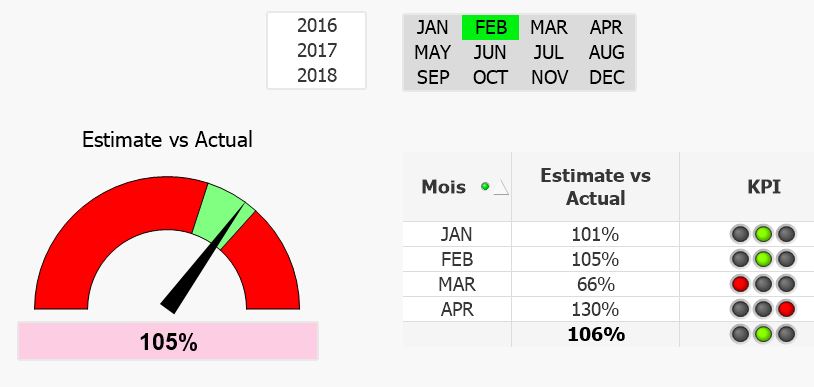
I need to compare Estimate vs Actual and show the output through a gauge in a table chart :
If Estmate / Actual is less than 90 % than the light should be red
If Estimate / Actual is between 90 % and 110 % the light should be green
If Estimate / Actual is greater than 110 % the light should be red.
I have been able to get the results through a three color gauge although i would like to have it through a two color gauge :
What i got is :
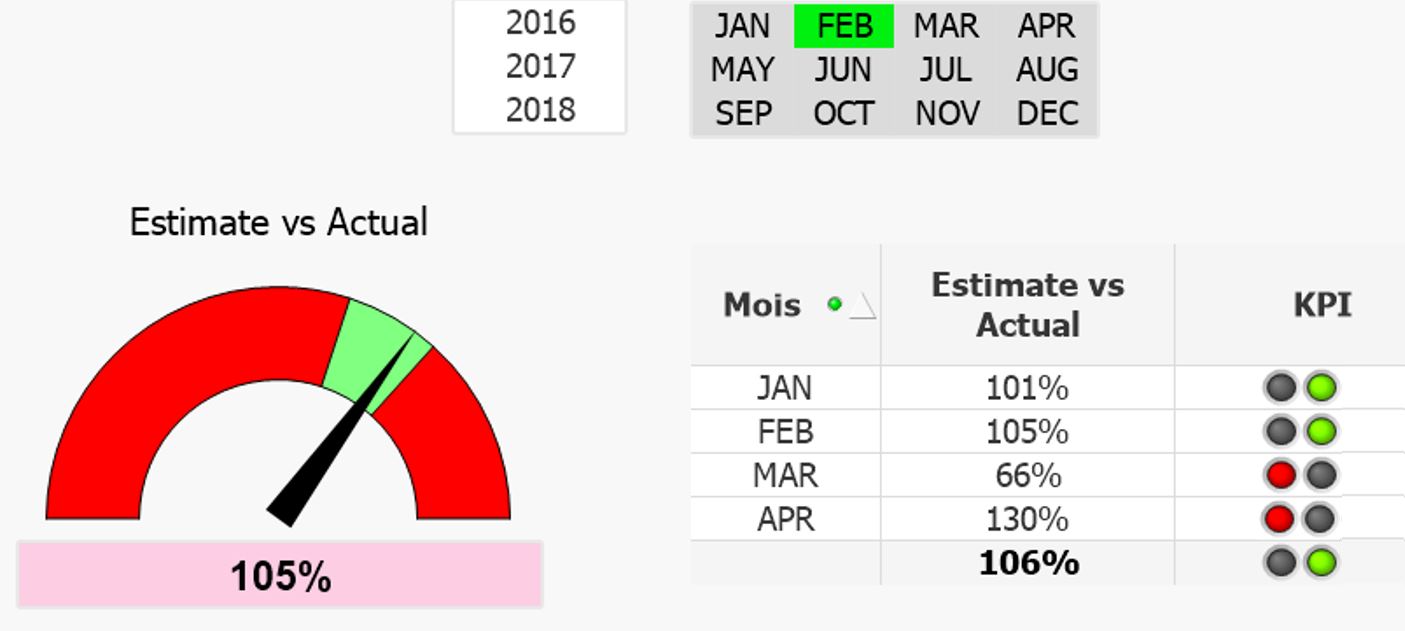
What i am looking for is :
Thanks for the one who want to help
Attached is qvw and excel test database
Guillaume
- Mark as New
- Bookmark
- Subscribe
- Mute
- Subscribe to RSS Feed
- Permalink
- Report Inappropriate Content
Hi everyone,
Is my request not possible to full fill ?
Guillaume
- Mark as New
- Bookmark
- Subscribe
- Mute
- Subscribe to RSS Feed
- Permalink
- Report Inappropriate Content
Hi,
Use as Expression foe KPI
=if(KeepChar([Estimate vs Actual],0123456789)>=90 and KeepChar([Estimate vs Actual],0123456789)<=110,1,0)
PFA