Unlock a world of possibilities! Login now and discover the exclusive benefits awaiting you.
- Qlik Community
- :
- All Forums
- :
- QlikView App Dev
- :
- Re: Getting the correct Total
- Subscribe to RSS Feed
- Mark Topic as New
- Mark Topic as Read
- Float this Topic for Current User
- Bookmark
- Subscribe
- Mute
- Printer Friendly Page
- Mark as New
- Bookmark
- Subscribe
- Mute
- Subscribe to RSS Feed
- Permalink
- Report Inappropriate Content
Getting the correct Total
Hi friends,
Not sure if this is an easy one, or if I am missing something stupid but I am trying to get proper total here which is definitely not 34,636,
Problem is that I am also dividing by 13 and obviously that figure is not correct, There is the total function as an option but when you use a Bar Graph , you do not get that option to get the proper total.
Thanks
- « Previous Replies
-
- 1
- 2
- Next Replies »
Accepted Solutions
- Mark as New
- Bookmark
- Subscribe
- Mute
- Subscribe to RSS Feed
- Permalink
- Report Inappropriate Content
I did sort it out in the end.
What I realised was that the other figures where correct and that was becuase the WeekAsOf table and the Figures tables are directly linked while the Users Players was linked to the Figures Table.
Although in theory it should have worked, I am assuming and will check further that Qlik is doing some selecting maybe some associated numbers for that total.. i don't know
but when I created a userid with a different name in the figures table and used that... it worked perfectly and robust.
So Im gona leave it to that for now..so thanks Sunny
- Mark as New
- Bookmark
- Subscribe
- Mute
- Subscribe to RSS Feed
- Permalink
- Report Inappropriate Content
You are dividing by 13? Don't see that in the expression above? But may be you can try using Aggr() function
Sum(Aggr(YourExpression, YourChartDimensions))
- Mark as New
- Bookmark
- Subscribe
- Mute
- Subscribe to RSS Feed
- Permalink
- Report Inappropriate Content
Sorry, did not to confuse with that /13
In this sample. there is only a simple count, no division by 13, what I meant is that I want that the actually correct total to divide it by 13 later but because the total is not correct its giving a confusing average
- Mark as New
- Bookmark
- Subscribe
- Mute
- Subscribe to RSS Feed
- Permalink
- Report Inappropriate Content
Have you tried my Suggestion to use the Aggr() function?
- Mark as New
- Bookmark
- Subscribe
- Mute
- Subscribe to RSS Feed
- Permalink
- Report Inappropriate Content
Hi,
yes I have, and it did not work with Sum(Aggr(YourExpression, YourChartDimensions))
It is something I think with the Set Analysis. But then the other amounts I got, they do not have that problem so I am slightly confused on that
- Mark as New
- Bookmark
- Subscribe
- Mute
- Subscribe to RSS Feed
- Permalink
- Report Inappropriate Content
Can you share (in text) your expression and dimensions for this chart?
- Mark as New
- Bookmark
- Subscribe
- Mute
- Subscribe to RSS Feed
- Permalink
- Report Inappropriate Content
Sure
Dimension : Week_AsOf
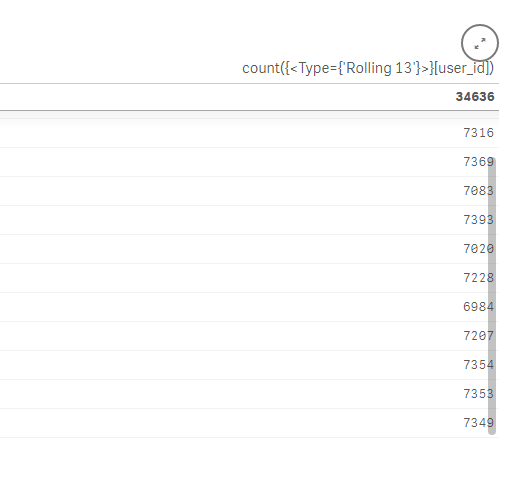
Expression: count({<Type={'Current'}>}[user_id])
Expression: count({<Type={'Rolling 13'}>}[user_id])/13
Actualy Data for it
| Dep_Week | Week_AsOf | Current | Rolling 13 | (Rolling13)/13 |
| 32 | 44 | 0 | 7291 | 560.85 |
| 33 | 44 | 0 | 7316 | 562.77 |
| 34 | 44 | 0 | 7369 | 566.85 |
| 35 | 44 | 0 | 7083 | 544.85 |
| 36 | 44 | 0 | 7393 | 568.69 |
| 37 | 44 | 0 | 7020 | 540.00 |
| 38 | 44 | 0 | 7228 | 556.00 |
| 39 | 44 | 0 | 6984 | 537.23 |
| 40 | 44 | 0 | 7207 | 554.38 |
| 41 | 44 | 0 | 7354 | 565.69 |
| 42 | 44 | 0 | 7353 | 565.62 |
| 43 | 44 | 0 | 7349 | 565.31 |
| 44 | 44 | 7,069 | 7069 | 543.77 |
- Mark as New
- Bookmark
- Subscribe
- Mute
- Subscribe to RSS Feed
- Permalink
- Report Inappropriate Content
So this did not work to get the correct total?
Sum(Aggr(Count({<Type={'Current'}>}[user_id]), Week_AsOf))
- Mark as New
- Bookmark
- Subscribe
- Mute
- Subscribe to RSS Feed
- Permalink
- Report Inappropriate Content
Well it give me on both coloums the total I already have
In the rolling 13 coloum its giving me 34,636 when in reality if you take the total of all those numbers, it comes up to 86,725
| 7,316 |
| 7,369 |
| 7,083 |
| 7,393 |
| 7,020 |
| 7,228 |
| 6,984 |
| 7,207 |
| 7,354 |
| 7,353 |
| 7,349 |
| 7,069 |
| 86,725 |
- Mark as New
- Bookmark
- Subscribe
- Mute
- Subscribe to RSS Feed
- Permalink
- Report Inappropriate Content
That is strange and have never seen something like this before. Would you be able to share a sample?
- « Previous Replies
-
- 1
- 2
- Next Replies »