Unlock a world of possibilities! Login now and discover the exclusive benefits awaiting you.
- Qlik Community
- :
- All Forums
- :
- QlikView App Dev
- :
- Google MAPs ( Values on Data Points)--> Urgent
- Subscribe to RSS Feed
- Mark Topic as New
- Mark Topic as Read
- Float this Topic for Current User
- Bookmark
- Subscribe
- Mute
- Printer Friendly Page
- Mark as New
- Bookmark
- Subscribe
- Mute
- Subscribe to RSS Feed
- Permalink
- Report Inappropriate Content
Google MAPs ( Values on Data Points)--> Urgent
Dear All,
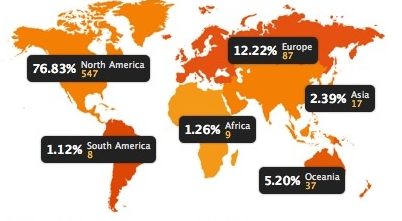
Does any one aware how to implement Google MAPs with ploting values on data points(beside to the bobbles or like in below image).
I have implemented MAPs using scatter chart working fine. But we can see values only when mouse hover on the bobble.
Our requirement is something like below.
Is there any extension will workout to show maps in below screen shot.
Does Qlik MAPs are capable of showing the MAPs like below?
MANY THANKS IN ADVANCE.
- Tags:
- new-to-qlikview
Accepted Solutions
- Mark as New
- Bookmark
- Subscribe
- Mute
- Subscribe to RSS Feed
- Permalink
- Report Inappropriate Content
Hi Chinna,
I think with default qlikview extensions or google maps it is not possible, you can try GeoQlik extension. Check this demo
qonnections.geoqlik.com/geoqlik/proxy/qvajaxzfc/opendoc.htm?document=1%20-%20Sales%20Management_11.8.qvw&host=QVS%40aslw0026&anonymous=true
and navigate AreaMap sheet.