Unlock a world of possibilities! Login now and discover the exclusive benefits awaiting you.
- Qlik Community
- :
- All Forums
- :
- QlikView App Dev
- :
- Re: Gradient color on pivot table based on each ro...
- Subscribe to RSS Feed
- Mark Topic as New
- Mark Topic as Read
- Float this Topic for Current User
- Bookmark
- Subscribe
- Mute
- Printer Friendly Page
- Mark as New
- Bookmark
- Subscribe
- Mute
- Subscribe to RSS Feed
- Permalink
- Report Inappropriate Content
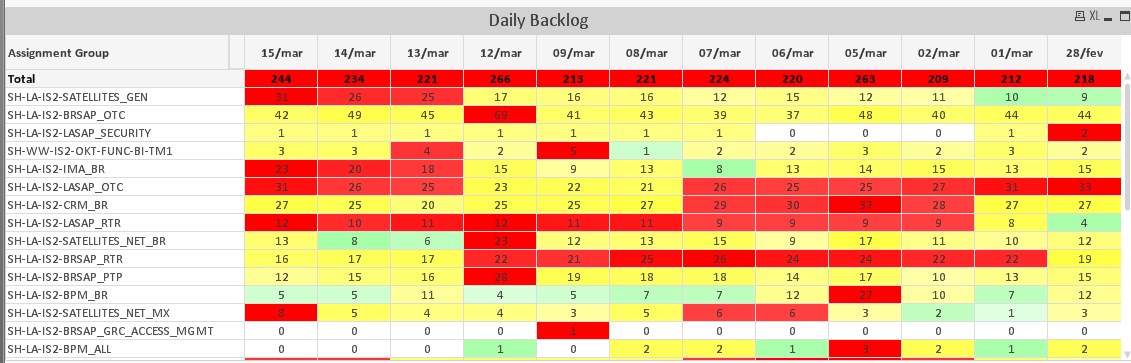
Gradient color on pivot table based on each row
Hi there,
I'd like to format a gradient background color on a pivot table considering each row separately. For exemple, my goal is to show higher values in red, middle values in yellow and lower values in green, but those values are to be considered for each row separately (taking into account that a row here is assembled by the dimension "Assingment Group" and the Dates).
The final result for each row, using excel, would be this:
![]()
This is the expression on the pivot table:
Count(DISTINCT {<Task_Source = {'Incidents'}, Task_SourceType = {'Opened'}, Task_RefDate= {">=$(=Date(Max(Task_RefDate)-15))"}>} Task_Number)
Attached is a sample.
Thanks in advance 
- « Previous Replies
-
- 1
- 2
- Next Replies »
Accepted Solutions
- Mark as New
- Bookmark
- Subscribe
- Mute
- Subscribe to RSS Feed
- Permalink
- Report Inappropriate Content
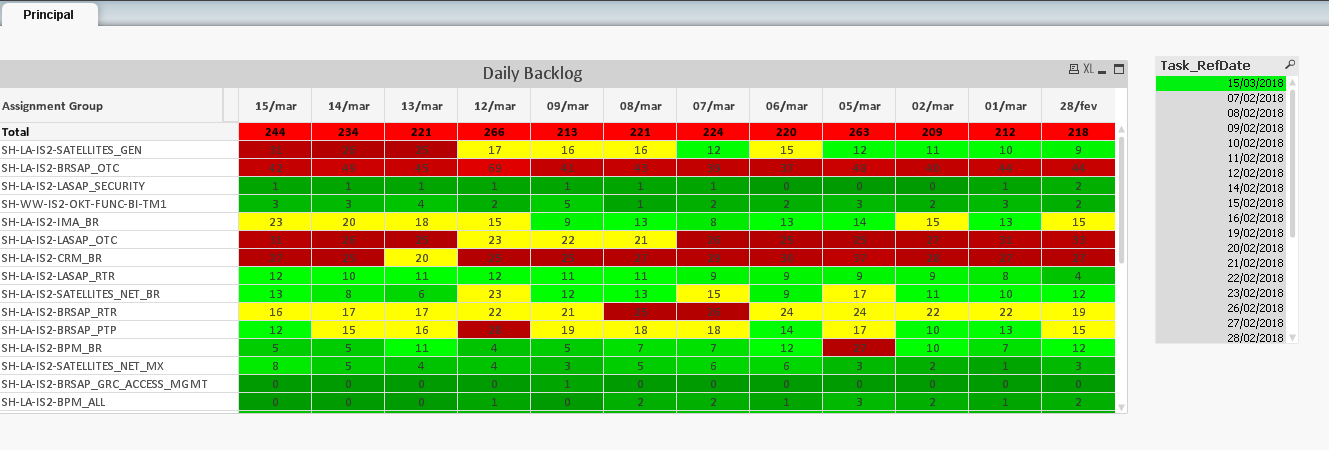
I think I found the solution, now I'm just playing to find the correct collors.
This was the expression to find the max per row:
Max(TOTAL <DeliveryCenter_AssignmentGroup> {<Task_Source = {'Incidents'}, Task_SourceType = {'Opened'}, Task_RefDate= {">=$(=Date(Max(Task_RefDate)-15))"}>}
Aggr(
Count(DISTINCT {<Task_Source = {'Incidents'}, Task_SourceType = {'Opened'}, Task_RefDate= {">=$(=Date(Max(Task_RefDate)-15))"}>} Task_Number)
, Task_RefDate, DeliveryCenter_AssignmentGroup)
)
Based on it, I just applied your concept of the Fractile, but using direct percentages. Now I just need to find the correct formula for the collors:
- Mark as New
- Bookmark
- Subscribe
- Mute
- Subscribe to RSS Feed
- Permalink
- Report Inappropriate Content
You can try something like this in the Background Color
=If(Count(DISTINCT {<Task_Source = {'Incidents'}, Task_SourceType = {'Opened'}, Task_RefDate= {">=$(=Date(Max(Task_RefDate)-15))"}>} Task_Number) >= 25,
RGB(155 + (100 * Count(DISTINCT {<Task_Source = {'Incidents'}, Task_SourceType = {'Opened'}, Task_RefDate= {">=$(=Date(Max(Task_RefDate)-15))"}>} Task_Number) / 100),0,0),
If( Count(DISTINCT {<Task_Source = {'Incidents'}, Task_SourceType = {'Opened'}, Task_RefDate= {">=$(=Date(Max(Task_RefDate)-15))"}>} Task_Number) >= 15,RGB(255,155 + (100*(Count(DISTINCT {<Task_Source = {'Incidents'}, Task_SourceType = {'Opened'}, Task_RefDate= {">=$(=Date(Max(Task_RefDate)-15))"}>} Task_Number)/15)),0),
RGB(0,155 +(100 * (Count(DISTINCT {<Task_Source = {'Incidents'}, Task_SourceType = {'Opened'}, Task_RefDate= {">=$(=Date(Max(Task_RefDate)-15))"}>} Task_Number)/10)),0)))
- Mark as New
- Bookmark
- Subscribe
- Mute
- Subscribe to RSS Feed
- Permalink
- Report Inappropriate Content
I actually did something like this, but then the max a min wouldn't be based on the maximum value of the row, it would be based on a fixed value...
I'd have to do that, but based on the max and min values of the row...
For example, if the number of tickets increases, 25 should be green and will appear in red
- Mark as New
- Bookmark
- Subscribe
- Mute
- Subscribe to RSS Feed
- Permalink
- Report Inappropriate Content
Instead of hard coding the values like I did, you can use the Fractile function to calculate the value based on a percentage.
=If(Count(DISTINCT {<Task_Source = {'Incidents'}, Task_SourceType = {'Opened'}, Task_RefDate= {">=$(=Date(Max(Task_RefDate)-15))"}>} Task_Number) >= Fractile(Count(DISTINCT {<Task_Source = {'Incidents'}, Task_SourceType = {'Opened'}>} Total Task_Number),50),
The Fractile will calculate the value that is 50% of the max. This way the colors vary based on the total amount. Say red above 50%, yellow above 25% else green.
The yellow does not vary much in shade.
- Mark as New
- Bookmark
- Subscribe
- Mute
- Subscribe to RSS Feed
- Permalink
- Report Inappropriate Content
Hi,
Try this expression in Background Color:
ColorMix2(
If(
Count(DISTINCT {<Task_Source = {'Incidents'}, Task_SourceType = {'Opened'}, Task_RefDate= {">=$(=Date(Max(Task_RefDate)-15))"}>} Task_Number)
<
Median(TOTAL <DeliveryCenter_AssignmentGroup> Aggr(Count(DISTINCT {<Task_Source = {'Incidents'}, Task_SourceType = {'Opened'}, Task_RefDate= {">=$(=Date(Max(Task_RefDate)-15))"}>} Task_Number),Task_RefDate,DeliveryCenter_AssignmentGroup))
,
(
Count(DISTINCT {<Task_Source = {'Incidents'}, Task_SourceType = {'Opened'}, Task_RefDate= {">=$(=Date(Max(Task_RefDate)-15))"}>} Task_Number)
-
Min(TOTAL <DeliveryCenter_AssignmentGroup> Aggr(Count(DISTINCT {<Task_Source = {'Incidents'}, Task_SourceType = {'Opened'}, Task_RefDate= {">=$(=Date(Max(Task_RefDate)-15))"}>} Task_Number),Task_RefDate,DeliveryCenter_AssignmentGroup))
)
/
(
Median(TOTAL <DeliveryCenter_AssignmentGroup> Aggr(Count(DISTINCT {<Task_Source = {'Incidents'}, Task_SourceType = {'Opened'}, Task_RefDate= {">=$(=Date(Max(Task_RefDate)-15))"}>} Task_Number),Task_RefDate,DeliveryCenter_AssignmentGroup))
-
Min(TOTAL <DeliveryCenter_AssignmentGroup> Aggr(Count(DISTINCT {<Task_Source = {'Incidents'}, Task_SourceType = {'Opened'}, Task_RefDate= {">=$(=Date(Max(Task_RefDate)-15))"}>} Task_Number),Task_RefDate,DeliveryCenter_AssignmentGroup))
) -1,
(
Count(DISTINCT {<Task_Source = {'Incidents'}, Task_SourceType = {'Opened'}, Task_RefDate= {">=$(=Date(Max(Task_RefDate)-15))"}>} Task_Number)
-
Median(TOTAL <DeliveryCenter_AssignmentGroup> Aggr(Count(DISTINCT {<Task_Source = {'Incidents'}, Task_SourceType = {'Opened'}, Task_RefDate= {">=$(=Date(Max(Task_RefDate)-15))"}>} Task_Number),Task_RefDate,DeliveryCenter_AssignmentGroup))
)
/
(
Max(TOTAL <DeliveryCenter_AssignmentGroup> Aggr(Count(DISTINCT {<Task_Source = {'Incidents'}, Task_SourceType = {'Opened'}, Task_RefDate= {">=$(=Date(Max(Task_RefDate)-15))"}>} Task_Number),Task_RefDate,DeliveryCenter_AssignmentGroup))
-
Median(TOTAL <DeliveryCenter_AssignmentGroup> Aggr(Count(DISTINCT {<Task_Source = {'Incidents'}, Task_SourceType = {'Opened'}, Task_RefDate= {">=$(=Date(Max(Task_RefDate)-15))"}>} Task_Number),Task_RefDate,DeliveryCenter_AssignmentGroup))
)
),
Red(), Green(), Yellow()
)
Saludos.
- Mark as New
- Bookmark
- Subscribe
- Mute
- Subscribe to RSS Feed
- Permalink
- Report Inappropriate Content
I didn't managed to make it work. I'm stuck with the total by Group and Date. The fractile is returning the total of all items or the total for the current date only.
- Mark as New
- Bookmark
- Subscribe
- Mute
- Subscribe to RSS Feed
- Permalink
- Report Inappropriate Content
Thanks for the answer
I'm still checking your code to see what could be, but it didn't worked here...
- Mark as New
- Bookmark
- Subscribe
- Mute
- Subscribe to RSS Feed
- Permalink
- Report Inappropriate Content
I think I found the solution, now I'm just playing to find the correct collors.
This was the expression to find the max per row:
Max(TOTAL <DeliveryCenter_AssignmentGroup> {<Task_Source = {'Incidents'}, Task_SourceType = {'Opened'}, Task_RefDate= {">=$(=Date(Max(Task_RefDate)-15))"}>}
Aggr(
Count(DISTINCT {<Task_Source = {'Incidents'}, Task_SourceType = {'Opened'}, Task_RefDate= {">=$(=Date(Max(Task_RefDate)-15))"}>} Task_Number)
, Task_RefDate, DeliveryCenter_AssignmentGroup)
)
Based on it, I just applied your concept of the Fractile, but using direct percentages. Now I just need to find the correct formula for the collors:
- Mark as New
- Bookmark
- Subscribe
- Mute
- Subscribe to RSS Feed
- Permalink
- Report Inappropriate Content
Hi Marco,
Could you help me? I have the same example to color each row.
My expression to calculate values is
(SUM(RISCO_C_11_14)+SUM(RISCO_D_15_30))
/
before(sum({1}RISCO_A_EM_DIA))
How can I create a gradient color following the same your conditions to higher,medium and lower values?
Tks a lot!!!
- Mark as New
- Bookmark
- Subscribe
- Mute
- Subscribe to RSS Feed
- Permalink
- Report Inappropriate Content
Hello Antonio, I believe you can use the solution above and just change my expression for yours.
If you're not able to do it, would be nice to have a sample of your application to look.
- « Previous Replies
-
- 1
- 2
- Next Replies »