Unlock a world of possibilities! Login now and discover the exclusive benefits awaiting you.
- Qlik Community
- :
- All Forums
- :
- QlikView App Dev
- :
- Grand Total in Pivot table chart
- Subscribe to RSS Feed
- Mark Topic as New
- Mark Topic as Read
- Float this Topic for Current User
- Bookmark
- Subscribe
- Mute
- Printer Friendly Page
- Mark as New
- Bookmark
- Subscribe
- Mute
- Subscribe to RSS Feed
- Permalink
- Report Inappropriate Content
Grand Total in Pivot table chart
See below expression, I am manually feeding numbers based on product and territory. I am using this as measure in Pivot table.
Problem is i am not getting Grand total sum it is coming out like this "-". I think it is because Qlik sense is not considering manual numbers as number. is there a way i can convert them to number format? swuehl mto
If([TerritoryLevel4] ='S_UKI',
(Pick(Match([Product Sub Category],'A','B','C','D','E','F','G','H','I','J','K','L','M','N')+1,
1774348,655502,1518050,517787,2101909,-9183,3072889,853903,1993201,1183086,2501750,37068,1279540,1723476,0)/1000000),
If([TerritoryLevel4] ='S_GER,
(Pick(Match([Product Sub Category],'A','B','C','D','E','F','G','H','I','J','K','L','M','N')+1,
1774348,655502,1518050,517787,2101909,-9183,3072889,853903,1993201,1183086,2501750,37068,1279540,1723476,0)/1000000),
If([TerritoryLevel4] ='S_FRA,
(Pick(Match([Product Sub Category],'A','B','C','D','E','F','G','H','I','J','K','L','M','N')+1,
1774348,655502,1518050,517787,2101909,-9183,3072889,853903,1993201,1183086,2501750,37068,1279540,1723476,0)/1000000),
If([TerritoryLevel3]='S_EMEA',(Pick(Match([Product Sub Category],'A','B','C','D','E','F','G','H','I','J','K','L','M','N')+1,
7087645,3100720,7239302,3495407,11574307,1767474,5451370,4072107,9562232,3658490,4785699,322131,6208621,5825034,0))/1000000,''))
Accepted Solutions
- Mark as New
- Bookmark
- Subscribe
- Mute
- Subscribe to RSS Feed
- Permalink
- Report Inappropriate Content
Try this:
Sum(Aggr(
If([TerritoryLevel4] ='S_UKI',
(Pick(Match([Product Sub Category],'A','B','C','D','E','F','G','H','I','J','K','L','M','N')+1,
1774348,655502,1518050,517787,2101909,-9183,3072889,853903,1993201,1183086,2501750,37068,1279540,1723476,0)/1000000),
If([TerritoryLevel4] ='S_GER,
(Pick(Match([Product Sub Category],'A','B','C','D','E','F','G','H','I','J','K','L','M','N')+1,
1774348,655502,1518050,517787,2101909,-9183,3072889,853903,1993201,1183086,2501750,37068,1279540,1723476,0)/1000000),
If([TerritoryLevel4] ='S_FRA,
(Pick(Match([Product Sub Category],'A','B','C','D','E','F','G','H','I','J','K','L','M','N')+1,
1774348,655502,1518050,517787,2101909,-9183,3072889,853903,1993201,1183086,2501750,37068,1279540,1723476,0)/1000000),
If([TerritoryLevel3]='S_EMEA',(Pick(Match([Product Sub Category],'A','B','C','D','E','F','G','H','I','J','K','L','M','N')+1,
7087645,3100720,7239302,3495407,11574307,1767474,5451370,4072107,9562232,3658490,4785699,322131,6208621,5825034,0))/1000000,''))
, Product, Category))
Assuming Product and Category are your chart dimensions
- Mark as New
- Bookmark
- Subscribe
- Mute
- Subscribe to RSS Feed
- Permalink
- Report Inappropriate Content
@Sunny T You are truly legend you have got correct level. I had been struggling from long time to get this i put sum before pick match before if statement none work. Your one solution bang on.
You should start your You tube channel there are very few videos of Qlik sense. I will be the first person to join your channel. Thank you.
- Mark as New
- Bookmark
- Subscribe
- Mute
- Subscribe to RSS Feed
- Permalink
- Report Inappropriate Content
Is it possible to get Grand total and Sub total at the bottom of dimensions in Pivot table chart in Qlik sense? Also how can i color few columns?
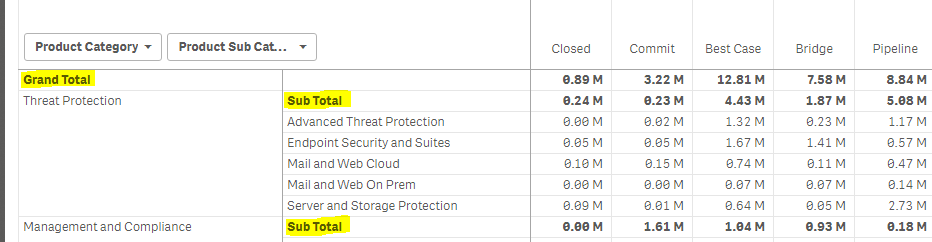
In above image, How to get Sub total of "Threat Protection" at bottom and Grand total at very bottom as we get in Excel pivot table.
Also, Is it possible to color Commit, Best case and Pipleine in Blue and others in Green color? swuehl stalwar1 gwassenaar