Unlock a world of possibilities! Login now and discover the exclusive benefits awaiting you.
- Qlik Community
- :
- All Forums
- :
- QlikView App Dev
- :
- Graph Selections
- Subscribe to RSS Feed
- Mark Topic as New
- Mark Topic as Read
- Float this Topic for Current User
- Bookmark
- Subscribe
- Mute
- Printer Friendly Page
- Mark as New
- Bookmark
- Subscribe
- Mute
- Subscribe to RSS Feed
- Permalink
- Report Inappropriate Content
Graph Selections
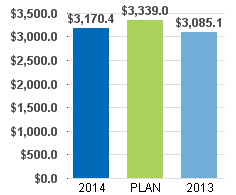
Is it possible to lock a graph from year selections being made? I know I can get rid of the list box selection, but is it possible to lock down a graphy from a yearly selection? The user wants the graph to remain static for all 3 years, and allow other non year selections to be made. Here is the graph:
Thank you,
Justin
- Tags:
- bar-chart
- selections
- « Previous Replies
-
- 1
- 2
- Next Replies »
Accepted Solutions
- Mark as New
- Bookmark
- Subscribe
- Mute
- Subscribe to RSS Feed
- Permalink
- Report Inappropriate Content
This is a workaround, but it solves your purpose. You can create another state and the list box for Year would be in a alternate state. Any selection made in the alternate state won't impact anything in your default state.
Note: But wherever you would want to use the expression which changes with the Year, you will have to make sure that it is associated with Alternate state's Year.
Second workaround is to create three expressions and no dimensions.
I am attaching a qvw in which I have tried to implement both methods for you. Please have a look and let me know what you think.
Best,
S
- Mark as New
- Bookmark
- Subscribe
- Mute
- Subscribe to RSS Feed
- Permalink
- Report Inappropriate Content
Use {<Year = {'*'}>} as your set modifier within your expression. This will make sure that all years display regardless of the selection.
Best,
S
- Mark as New
- Bookmark
- Subscribe
- Mute
- Subscribe to RSS Feed
- Permalink
- Report Inappropriate Content
Sunindia,
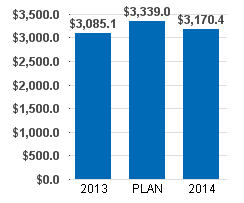
Thank you for the help that will keep all the selections on the chart. That will however move the selections around if the user selects a different year, and also changes the color to all one year. Is there a way to lock everything down? I have inclosed two pictures:

Justin
- Mark as New
- Bookmark
- Subscribe
- Mute
- Subscribe to RSS Feed
- Permalink
- Report Inappropriate Content
Locking everything down could be done using this {1}, but I thought you said that you want the user to be able to make non-year related selections.
To understand what happened, when you made a selection on the year all the three bars changed to show the same color?
Best,
S
- Mark as New
- Bookmark
- Subscribe
- Mute
- Subscribe to RSS Feed
- Permalink
- Report Inappropriate Content
ignore some selections
Ignore all selections except some specific fields using Set Analysis
or maybe with set analysis
sum( {1} Sales )
returns total sales within the application, disregarding the selection but not the dimension. If used in a chart with e.g. Products as dimension, each product will get a different value.
- Mark as New
- Bookmark
- Subscribe
- Mute
- Subscribe to RSS Feed
- Permalink
- Report Inappropriate Content
Sunindia,
That is correct, I want to allow them to select different products or different months, but I do not want the Year to be a selection. When Year is selected, the charts all turn the same color like in the bottom picture I included. I also tried set analysis with Year = , but that changed to the same color Year as well.
- Mark as New
- Bookmark
- Subscribe
- Mute
- Subscribe to RSS Feed
- Permalink
- Report Inappropriate Content
Are you using one expression and Year as your dimension or are you using three expressions??
Best,
S
- Mark as New
- Bookmark
- Subscribe
- Mute
- Subscribe to RSS Feed
- Permalink
- Report Inappropriate Content
I am using one expression for all 3 years. I was trying to avoid having to use 3 expressions if possible since I have replicated this similar graph about 8 times. Do you think that will fix the problem?
Thanks,
Justin
- Mark as New
- Bookmark
- Subscribe
- Mute
- Subscribe to RSS Feed
- Permalink
- Report Inappropriate Content
No I think what you are doing is correct. One question that comes to my mind is: Are you using some kind of if statement for the Background Color? Cause that is the only way you can color the bars in different colors when they all originate from the same the expression.
Let me if you are using a statement there and it would be great if you can post what you are doing.
Best,
S
- Mark as New
- Bookmark
- Subscribe
- Mute
- Subscribe to RSS Feed
- Permalink
- Report Inappropriate Content
Massimo,
I tried using the expression suggested but I received a syntax error. Here is the expression I tried:
sum({$<[$(=Concat({1<$Field-={'YEAR'}>}distinct $Field,']=,[')&']=')>} Amount)
Any suggestions for how I can alter the statement to work correctly? I have a couple of other fields in the set analysis as well, and I just put a comman after ]=')
Thanks,
Justin
- « Previous Replies
-
- 1
- 2
- Next Replies »