Unlock a world of possibilities! Login now and discover the exclusive benefits awaiting you.
- Qlik Community
- :
- All Forums
- :
- QlikView App Dev
- :
- Group expressions in rows to allow expand/collaps ...
- Subscribe to RSS Feed
- Mark Topic as New
- Mark Topic as Read
- Float this Topic for Current User
- Bookmark
- Subscribe
- Mute
- Printer Friendly Page
- Mark as New
- Bookmark
- Subscribe
- Mute
- Subscribe to RSS Feed
- Permalink
- Report Inappropriate Content
Group expressions in rows to allow expand/collaps function
Hello,
Is it possible to group expressions and then be able to expand collaps them in a pivot table (like you can do with dimensions)
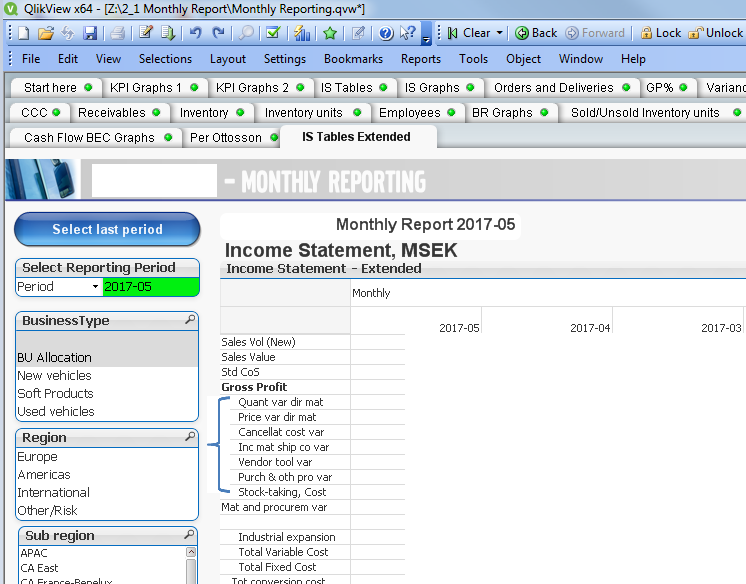
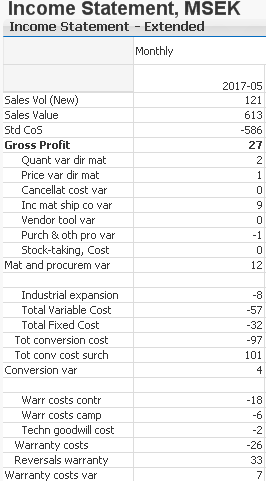
So, in below picture I have an expression for each row. I would like to be able to group Quant var dir mat --> stock-taking, cost as they sum up to mat and procurem var and then be able to expand/collaps with +/- symbol.
Is there an easy way to do this?
- « Previous Replies
-
- 1
- 2
- Next Replies »
Accepted Solutions
- Mark as New
- Bookmark
- Subscribe
- Mute
- Subscribe to RSS Feed
- Permalink
- Report Inappropriate Content
May be couple of ways
1) Create synthetic dimensions and add those expression as a dimension and use a single expression
2) May be create a text object with +/- sign and conditionally hide show expressions based on button click
- Mark as New
- Bookmark
- Subscribe
- Mute
- Subscribe to RSS Feed
- Permalink
- Report Inappropriate Content
Ok, not an answer I was hoping for 
Neither options seems like good options for me as I would need quite a lot of them. Then I guess the users will have to live with fully expanded rows.
I was hoping there was a built in function that could solve it.
Thanks anyway Sunny.
- Mark as New
- Bookmark
- Subscribe
- Mute
- Subscribe to RSS Feed
- Permalink
- Report Inappropriate Content
Don't like the second option as well? Its not that difficult to do this...
- Mark as New
- Bookmark
- Subscribe
- Mute
- Subscribe to RSS Feed
- Permalink
- Report Inappropriate Content
I totally agree that second option suggest ed by stalwar1 is quite practical and should be quickly to implement
- Mark as New
- Bookmark
- Subscribe
- Mute
- Subscribe to RSS Feed
- Permalink
- Report Inappropriate Content
Well, but I am afraid that the relative postion of +/- sign will be very confusing for the users if some are expanded and some are not.
See below. So If I would go for option 2 and have the table expanded, then the +/- sign will not be positioned next to the correct row, right?
- Mark as New
- Bookmark
- Subscribe
- Mute
- Subscribe to RSS Feed
- Permalink
- Report Inappropriate Content
You can use two buttons instead of 1... but yes it will not be as easy as an inbuilt thing....
- Mark as New
- Bookmark
- Subscribe
- Mute
- Subscribe to RSS Feed
- Permalink
- Report Inappropriate Content
How about using two buttons, where one button will expand the Chart to fullest and other one will collapse it. You can a use a variable and set it to 0 or 1 on button/text box press actions and use this variable to show/hide two pivot chart (one which is fully expanded and other one would be the current chart you have.
- Mark as New
- Bookmark
- Subscribe
- Mute
- Subscribe to RSS Feed
- Permalink
- Report Inappropriate Content
I mean, if you can consider placing those two text box/buttons not in the chart (so you don't have to worry about their relative position) may be above the chart (where it can attract user quickly)
- Mark as New
- Bookmark
- Subscribe
- Mute
- Subscribe to RSS Feed
- Permalink
- Report Inappropriate Content
Hello guys!
Ok, that would probably be better than nothing.
If you have time I would highly appreciate if you could tell me what to type in as conditional formula and how to link it to the +/-image
- « Previous Replies
-
- 1
- 2
- Next Replies »