Unlock a world of possibilities! Login now and discover the exclusive benefits awaiting you.
- Qlik Community
- :
- All Forums
- :
- QlikView App Dev
- :
- Re: Headcount vs Budget with variance
- Subscribe to RSS Feed
- Mark Topic as New
- Mark Topic as Read
- Float this Topic for Current User
- Bookmark
- Subscribe
- Mute
- Printer Friendly Page
- Mark as New
- Bookmark
- Subscribe
- Mute
- Subscribe to RSS Feed
- Permalink
- Report Inappropriate Content
Headcount vs Budget with variance
I'm working on showing variance to budget for headcount, hours and dollars. The headcount piece is difficult to show correctly due to way I'm calculating the values for headcount: actual is the distinct count of employee id while budget is the max headcount value by area (I don't want to enter employee id records into the budget so I enter a value by area, by day).
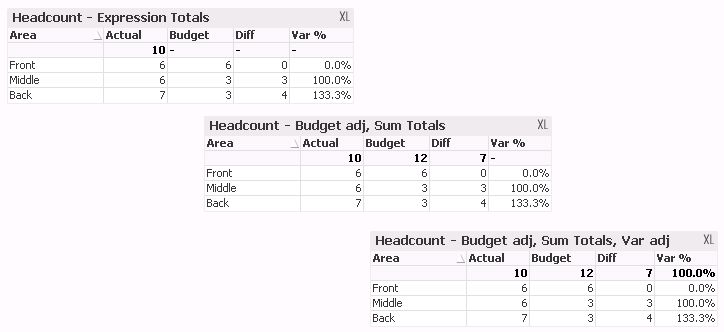
Using Aggr and Max, I can get the values to show correctly for each day and for multiple days, but the total, difference and variance don't calculate how I want them to. You can see 3 different attempts in the attached example. The first is a simple calculation using expression totals and doesn't give meaningful results. The second filters out null values from the budget and uses Sum of rows for the total - the difference works for a day but not multiple days and the variance doesn't work. In the third I attempted to fix the variance to adjust for zero values in the budget or actuals but that's not any better.
Any ideas on how I should attack this problem?
Arnie
Accepted Solutions
- Mark as New
- Bookmark
- Subscribe
- Mute
- Subscribe to RSS Feed
- Permalink
- Report Inappropriate Content
I'm not sure if I have understood you correctly. However, based on your first attempt change the budget expression to this:
sum(Aggr(Max({<FactType={"Budget"}>} Headcount), Area))
and the Var % expressioin to:
=Diff/Actual
Does this solve your problem? Or have I misunderstood you?
- Mark as New
- Bookmark
- Subscribe
- Mute
- Subscribe to RSS Feed
- Permalink
- Report Inappropriate Content
Thanks Christopher! Adding the Sum() corrected the budget expression and allowed the existing Diff and Var % expressions to work as well.
- Mark as New
- Bookmark
- Subscribe
- Mute
- Subscribe to RSS Feed
- Permalink
- Report Inappropriate Content
hi arnie,
did you ever convert the data to a graph or chart?
thanks!
- Mark as New
- Bookmark
- Subscribe
- Mute
- Subscribe to RSS Feed
- Permalink
- Report Inappropriate Content
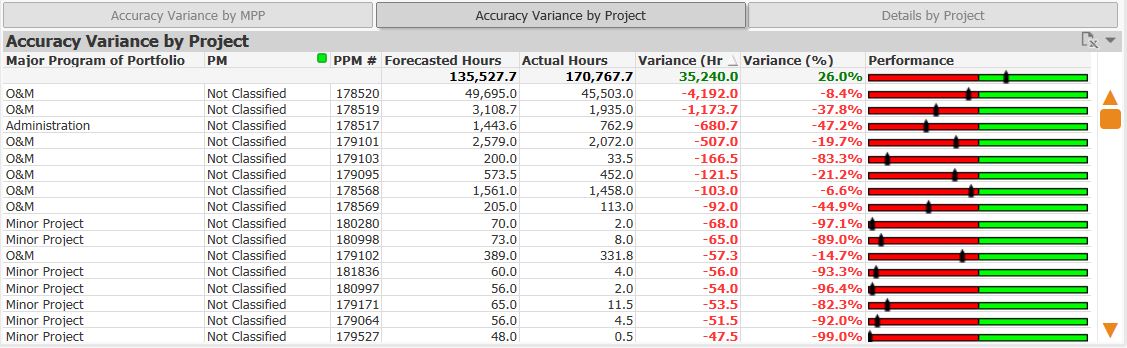
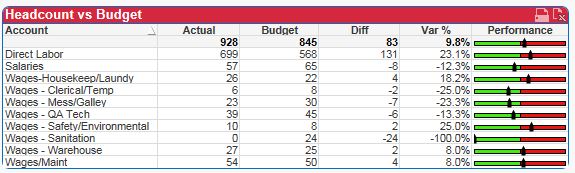
I pulled the data into a straight table and used a linear gauge to show performance vs plan visually. That seemed the best solution for our needs.
- Mark as New
- Bookmark
- Subscribe
- Mute
- Subscribe to RSS Feed
- Permalink
- Report Inappropriate Content
Hey Arnie,
ive been away & busy start of the year. But my team likes your linear gauge & wants me use that since what we have in excel isnt recreatable in QV yet.
- Mark as New
- Bookmark
- Subscribe
- Mute
- Subscribe to RSS Feed
- Permalink
- Report Inappropriate Content
Hey Arnie,
i created 4 version of the linear gauge. worked out great!
thx again!