Unlock a world of possibilities! Login now and discover the exclusive benefits awaiting you.
- Qlik Community
- :
- All Forums
- :
- QlikView App Dev
- :
- Heat map in Qlikview
- Subscribe to RSS Feed
- Mark Topic as New
- Mark Topic as Read
- Float this Topic for Current User
- Bookmark
- Subscribe
- Mute
- Printer Friendly Page
- Mark as New
- Bookmark
- Subscribe
- Mute
- Subscribe to RSS Feed
- Permalink
- Report Inappropriate Content
Heat map in Qlikview
Dear All,
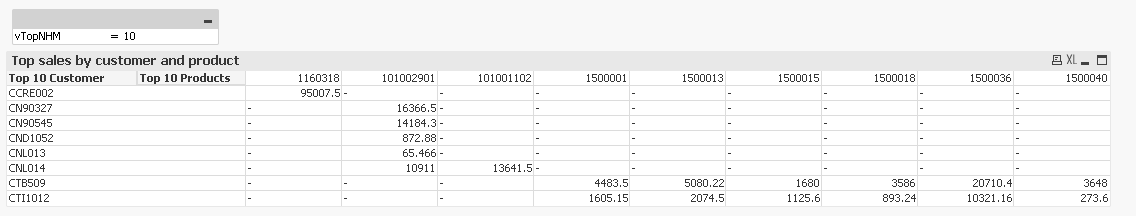
I am trying to create heat map using pivot table with below mentioned calculated dimensions and metric.
Customer =aggr(if(rank(aggr(sum(SalesValue*SalesQty), CustomerCode) <= $(vTopNHM)), CustomerName),CustomerName)
products =aggr(if(rank(aggr(sum(SalesValue*SalesQty), ProductCode) <= $(vTopNHM)), ProductCode),ProductCode)
expression sum(SalesValue*SalesQty)
I am using a variable in the input box to provide the number of customer information the user want to see. But however after entering the number in input box, the chart is not updating. It is showing all customer information.
Any suggestions where i am going wrong ?
Thank you.
Regards,
VK
- « Previous Replies
- Next Replies »
Accepted Solutions
- Mark as New
- Bookmark
- Subscribe
- Mute
- Subscribe to RSS Feed
- Permalink
- Report Inappropriate Content
- Mark as New
- Bookmark
- Subscribe
- Mute
- Subscribe to RSS Feed
- Permalink
- Report Inappropriate Content
Would you be able to share a sample to show the issue?
- Mark as New
- Bookmark
- Subscribe
- Mute
- Subscribe to RSS Feed
- Permalink
- Report Inappropriate Content
Hi Sunny,
Please find the attached file and let me know if you need any further details.
Regards,
Viresh
- Mark as New
- Bookmark
- Subscribe
- Mute
- Subscribe to RSS Feed
- Permalink
- Report Inappropriate Content
Envision something like this?
- Mark as New
- Bookmark
- Subscribe
- Mute
- Subscribe to RSS Feed
- Permalink
- Report Inappropriate Content
Yes
- Mark as New
- Bookmark
- Subscribe
- Mute
- Subscribe to RSS Feed
- Permalink
- Report Inappropriate Content
I have attached the file with my previous response for you to look at. If you got what you wanted, please close the thread.
Best,
Sunny
- Mark as New
- Bookmark
- Subscribe
- Mute
- Subscribe to RSS Feed
- Permalink
- Report Inappropriate Content
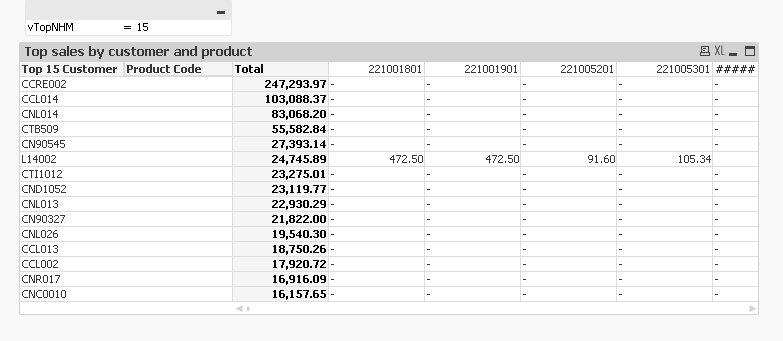
Hi, I tried to change the top customer count 15 but i am getting only 11 customer and 14 products.
can you please check it once.
Thank you.
- Mark as New
- Bookmark
- Subscribe
- Mute
- Subscribe to RSS Feed
- Permalink
- Report Inappropriate Content
Can you let me know what exactly is the expected output when 15 is selected? I mean which Product and Customers need to show up?
- Mark as New
- Bookmark
- Subscribe
- Mute
- Subscribe to RSS Feed
- Permalink
- Report Inappropriate Content
and also i need to sort the data based on sales value. Currently it is not sorting the data and customer with highest sales should come first.
thank you
- Mark as New
- Bookmark
- Subscribe
- Mute
- Subscribe to RSS Feed
- Permalink
- Report Inappropriate Content
Top 15 customers with highest sales and sorted in the descending order.
- « Previous Replies
- Next Replies »