Unlock a world of possibilities! Login now and discover the exclusive benefits awaiting you.
- Qlik Community
- :
- All Forums
- :
- QlikView App Dev
- :
- Help post for Combo Chart
- Subscribe to RSS Feed
- Mark Topic as New
- Mark Topic as Read
- Float this Topic for Current User
- Bookmark
- Subscribe
- Mute
- Printer Friendly Page
- Mark as New
- Bookmark
- Subscribe
- Mute
- Subscribe to RSS Feed
- Permalink
- Report Inappropriate Content
Help post for Combo Chart
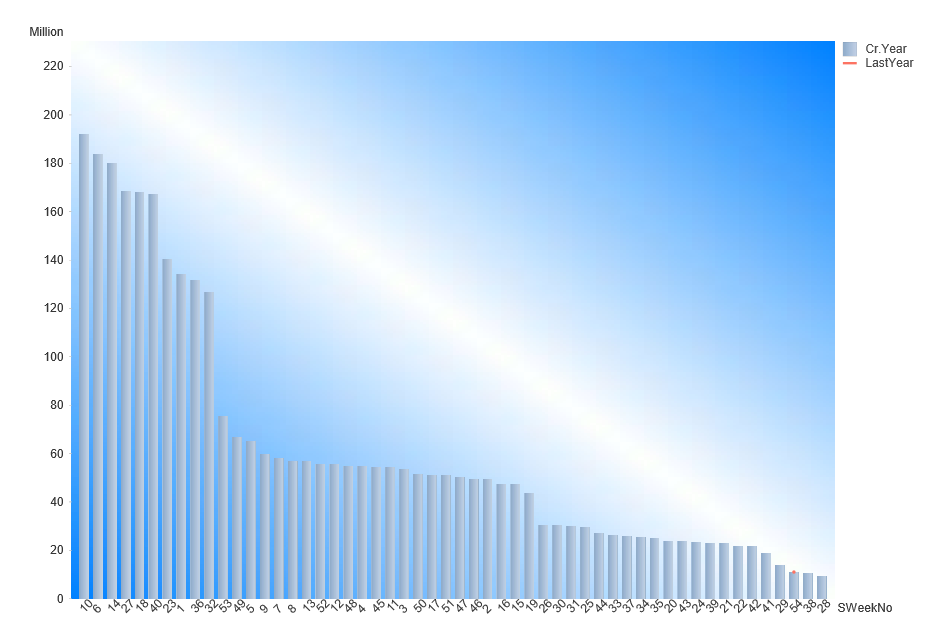
Hi, i'm facing some problem in my qlikview Combo chart design.
In my design, x-axes will be show week number and y-axes Sales Value.
X-axes is ok, but Y-axes show two value, one value i mean Bar is ok but Line not show anything.
1. Bar: Current year total value like sum(Sales) .
2. Line: Last Year Total Sales. so expression definition i'm using this expression: if(Year=2016,sum(sales))
but no result. So may i asked you my expression is right ?
Could you please help them ??
- Tags:
- combo chart
Accepted Solutions
- Mark as New
- Bookmark
- Subscribe
- Mute
- Subscribe to RSS Feed
- Permalink
- Report Inappropriate Content
May be these?
For Bar chart & Line chart expressions are
1) Sum({<Year = {'$(=Max(Year))'}>}Sales)
2) 1) Sum({<Year = {'$(=AddYears(Max(Year),-1))'}>}Sales)
- Mark as New
- Bookmark
- Subscribe
- Mute
- Subscribe to RSS Feed
- Permalink
- Report Inappropriate Content
Try
if(Year=2016,sum(sales),)
or
sum({<Year={'2016'}>}Sales)
- Mark as New
- Bookmark
- Subscribe
- Mute
- Subscribe to RSS Feed
- Permalink
- Report Inappropriate Content
May be these?
For Bar chart & Line chart expressions are
1) Sum({<Year = {'$(=Max(Year))'}>}Sales)
2) 1) Sum({<Year = {'$(=AddYears(Max(Year),-1))'}>}Sales)
- Mark as New
- Bookmark
- Subscribe
- Mute
- Subscribe to RSS Feed
- Permalink
- Report Inappropriate Content
Big thanks to all of you ...
- Mark as New
- Bookmark
- Subscribe
- Mute
- Subscribe to RSS Feed
- Permalink
- Report Inappropriate Content
If your question is now answered, please flag the Correct Answer (via the big "Correct Answer" button near every post) and Helpful Answers (found under the Actions menu under every post).
If not, please make clear what part of this topic you still need help with  .
.