Unlock a world of possibilities! Login now and discover the exclusive benefits awaiting you.
- Qlik Community
- :
- All Forums
- :
- QlikView App Dev
- :
- Help required in creating a cross tab chart
- Subscribe to RSS Feed
- Mark Topic as New
- Mark Topic as Read
- Float this Topic for Current User
- Bookmark
- Subscribe
- Mute
- Printer Friendly Page
- Mark as New
- Bookmark
- Subscribe
- Mute
- Subscribe to RSS Feed
- Permalink
- Report Inappropriate Content
Help required in creating a cross tab chart
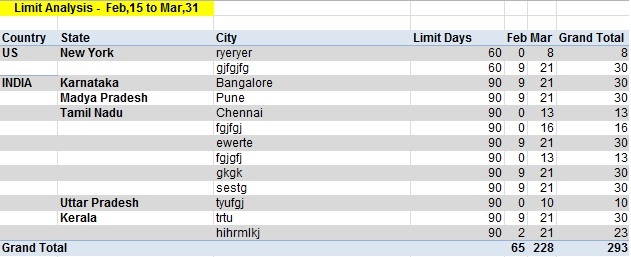
I want to create a chart similar to one mentioned in the screen shot. We dont have Month field in our DM. We are just creating it using MonthName(Period) for Month Field and dragging it to the top of expression to make it as cross tab. Basically what i want(Under the month) is that count of number of days the value is < 1 in a month(Basically count of TRUE value of a month based on the below expression).
Please let me know if the requirement is not clear yet.
=IF(
IF(maxstring({<$(e_DateRange)>}Limit_Days)='last_30',$(e_Days('l_30')),
IF(maxstring({<$(e_DateRange)>}Limit_Days)='last_60',$(e_Days('l_60')),
IF(maxstring({<$(e_DateRange)>}Limit_Days)='last_90',$(e_Days('l_90')),
IF(maxstring({<$(e_DateRange)>}Limit_Days)='TBD',$(e_Days('l_60')))
)
)
)<1
,replace(sum(TOTAL{<Period = {'>$(=date($(VMaxPeriod)-$(VDays))) <=$(=date($(VMaxPeriod))) '}>} 1),1,'TRUE'),
replace(sum(TOTAL{<Period = {'>$(=date($(VMaxPeriod)-$(VDays))) <=$(=date($(VMaxPeriod))) '}>} 0),0,'FALSE')
)
- Mark as New
- Bookmark
- Subscribe
- Mute
- Subscribe to RSS Feed
- Permalink
- Report Inappropriate Content
Can you post a small qlikview document that includes sample data? It will make it easier to work out a solution.
talk is cheap, supply exceeds demand
- Mark as New
- Bookmark
- Subscribe
- Mute
- Subscribe to RSS Feed
- Permalink
- Report Inappropriate Content
Some how I have managed to count number of TRUE value for a month using below expression and by adding Month in the dimension. But the issue here is when there is no TRUE value exists it has display 0 but in my case it is not displaying any records. Please help me out on this?
=Sum(Aggr(IF(
IF(maxstring({<$(e_DateRange)>}Limit_Days)='last_30',$(e_Days('l_30')),
IF(maxstring({<$(e_DateRange)>}Limit_Days)='last_60',$(e_Days('l_60')),
IF(maxstring({<$(e_DateRange)>}Limit_Days)='last_90',$(e_Days('l_90')),
IF(maxstring({<$(e_DateRange)>}Limit_Days)='TBD',$(e_Days('l_60')))
)
)
)<1
,1, 0 ),Period))