Unlock a world of possibilities! Login now and discover the exclusive benefits awaiting you.
- Qlik Community
- :
- All Forums
- :
- QlikView App Dev
- :
- Re: Help with background color gradient in pivot t...
- Subscribe to RSS Feed
- Mark Topic as New
- Mark Topic as Read
- Float this Topic for Current User
- Bookmark
- Subscribe
- Mute
- Printer Friendly Page
- Mark as New
- Bookmark
- Subscribe
- Mute
- Subscribe to RSS Feed
- Permalink
- Report Inappropriate Content
Help with background color gradient in pivot table
Hi,
I am trying to implement background color gradient based on an expression values in a pivot chart. I would like to get the pivot to look like this:
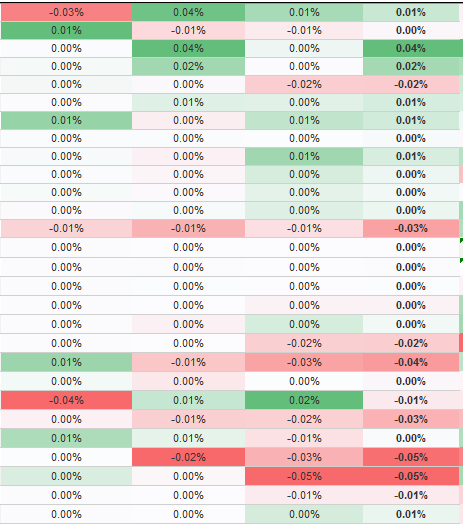
Lowest value is Red and max is green. All +ve values are shades of green and -ve values shades of red.
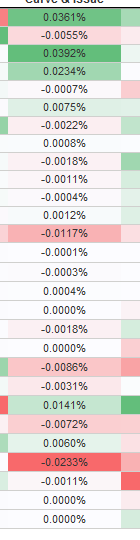
Also the values are formatted to show as '#.00%' but the shading is based on the exact values. That's why you can see that some of the cell have a shade even though the value appears to be '0.00%'. (as shown in the 2nd screen grab attached.
Any help on how I can achieve this in my chart. I have played around with colormix but cant get it to work as required.
Thank you.
- Mark as New
- Bookmark
- Subscribe
- Mute
- Subscribe to RSS Feed
- Permalink
- Report Inappropriate Content
QlikView Technical Brief - RGB() and ARGB() when to use each.zip
- Mark as New
- Bookmark
- Subscribe
- Mute
- Subscribe to RSS Feed
- Permalink
- Report Inappropriate Content
Hi,
you should be able to get the desired output using the Colormix() function.
there is a wizard dedicated to help generate the coloring expression.
share with us your expression
- Mark as New
- Bookmark
- Subscribe
- Mute
- Subscribe to RSS Feed
- Permalink
- Report Inappropriate Content
Hi,
You have to use ColorMix2()
This is an example:
![2018-04-19 17_48_59-QlikView - [Supervivencia_Altas v0.042_VER_PROVEEDOR_].png](/legacyfs/online/200244_2018-04-19 17_48_59-QlikView - [Supervivencia_Altas v0.042_VER_PROVEEDOR_].png)
Saludos
- Mark as New
- Bookmark
- Subscribe
- Mute
- Subscribe to RSS Feed
- Permalink
- Report Inappropriate Content
Thanks guys.
I was using colormix but was configuring the intermediate value incorrectly.
Managed to fix it.
This is the working expression:
ColorMix2 (if($(vCountryDurationDiff)<Num(0,'#,##.00%'),-Sqrt(-($(vCountryDurationDiff)-Num(0,'#,##.00%'))/(Num(0,'#,##.00%')-RangeMin (top(total $(vCountryDurationDiff),1,NoOfRows(total))))),Sqrt(($(vCountryDurationDiff)-Num(0,'#,##.00%'))/(RangeMax (top(total $(vCountryDurationDiff),1,NoOfRows(total)))-Num(0,'#,##.00%')))), ARGB(255, 248,105,107), ARGB(255, 99,190,123), ARGB(255, 255, 255, 255))
Thanks.
- Mark as New
- Bookmark
- Subscribe
- Mute
- Subscribe to RSS Feed
- Permalink
- Report Inappropriate Content
This is the difficult to say without knowing your original expression.. I suggest you to do using If...Else with BG color one for ARGB() for Light shade.
- Mark as New
- Bookmark
- Subscribe
- Mute
- Subscribe to RSS Feed
- Permalink
- Report Inappropriate Content
Hi!
I'm trying to do something similar, but I can't, needs to be similar to my old tableau table, my measure is: count(distinct([Unique Value])).
The max number is the red one and min number should be gray

Old tableau table

New pivot table in QlikSense
Can you guide me, thanks in advance!