Unlock a world of possibilities! Login now and discover the exclusive benefits awaiting you.
- Qlik Community
- :
- All Forums
- :
- QlikView App Dev
- :
- Horizontal Bar Graph
- Subscribe to RSS Feed
- Mark Topic as New
- Mark Topic as Read
- Float this Topic for Current User
- Bookmark
- Subscribe
- Mute
- Printer Friendly Page
- Mark as New
- Bookmark
- Subscribe
- Mute
- Subscribe to RSS Feed
- Permalink
- Report Inappropriate Content
Horizontal Bar Graph
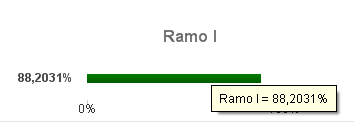
Hello i need to generate an horizontal linear graph but with percentage datas.
I have seen that the coloured part is not correctly dimensioned (always is filled the 100% of the coloured part).
Are there any settings that can i use in order to set the correct colour part to fill the exact percentage area?
This is the horizontal bar graph in which the 88 percentage is filled as 100%:
Thanks
Marco
- Mark as New
- Bookmark
- Subscribe
- Mute
- Subscribe to RSS Feed
- Permalink
- Report Inappropriate Content
Hi,
Once check the expression, like added expression/total or not.
If not always it will show 100%
- Mark as New
- Bookmark
- Subscribe
- Mute
- Subscribe to RSS Feed
- Permalink
- Report Inappropriate Content
i think you put 100% stacked..
May check your expression if you are really calculating the percentage...?
share your expression if you are using any set analysis?
share sample app and your requiment indetail..
attached qvw may help you
br,
chinna
- Mark as New
- Bookmark
- Subscribe
- Mute
- Subscribe to RSS Feed
- Permalink
- Report Inappropriate Content
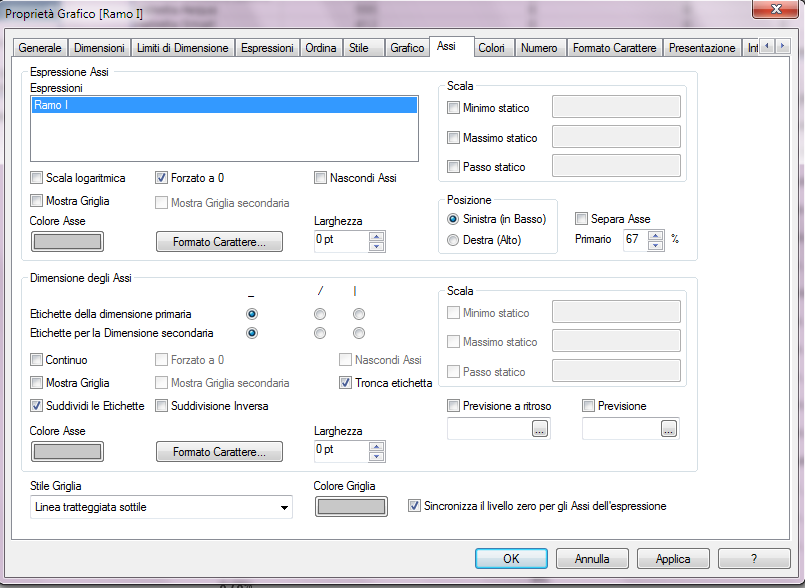
maybe you can define a static max (to 100%)
see tab axes
- Mark as New
- Bookmark
- Subscribe
- Mute
- Subscribe to RSS Feed
- Permalink
- Report Inappropriate Content
These are the settings:
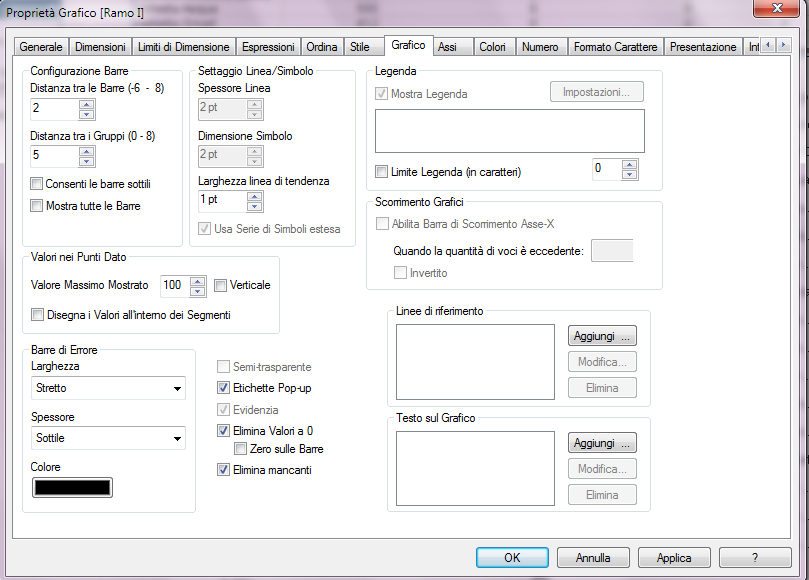
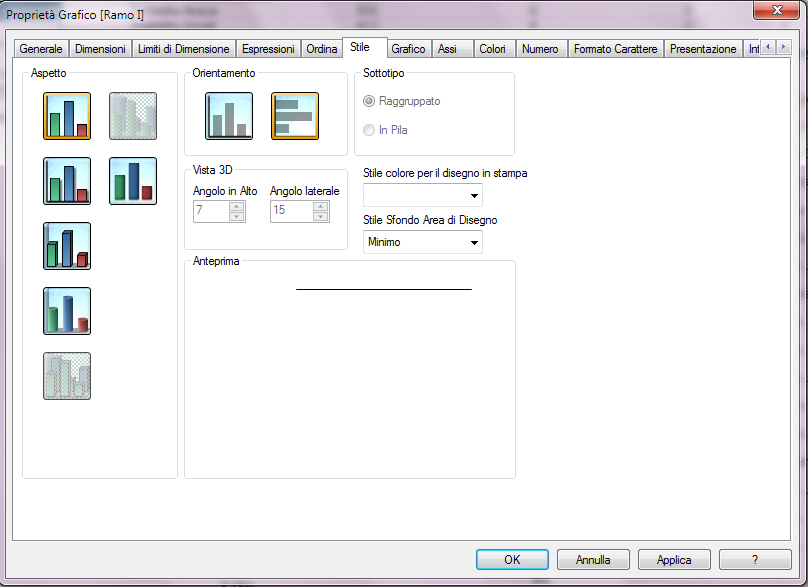
What have i to change?
Thanks
Marco
- Mark as New
- Bookmark
- Subscribe
- Mute
- Subscribe to RSS Feed
- Permalink
- Report Inappropriate Content
Enable Proprieta Grafico->Scala->Massimo Statico and put 1 in the input field
- Mark as New
- Bookmark
- Subscribe
- Mute
- Subscribe to RSS Feed
- Permalink
- Report Inappropriate Content
Thanks, now it works.
Marco