Unlock a world of possibilities! Login now and discover the exclusive benefits awaiting you.
- Qlik Community
- :
- All Forums
- :
- QlikView App Dev
- :
- Hours in axes
- Subscribe to RSS Feed
- Mark Topic as New
- Mark Topic as Read
- Float this Topic for Current User
- Bookmark
- Subscribe
- Mute
- Printer Friendly Page
- Mark as New
- Bookmark
- Subscribe
- Mute
- Subscribe to RSS Feed
- Permalink
- Report Inappropriate Content
Hours in axes
Hello,
I am writing to you because I would like to display ours in axes of a chart.
I get data from a database to the format "dd/mm/yyyy hh:mm:ss" and I convert it in the script in hours with :
Time(HM_ACTIONREAL) as [Action Time]
But in my chart, the total of time is good, but in axes I don't have a time format.
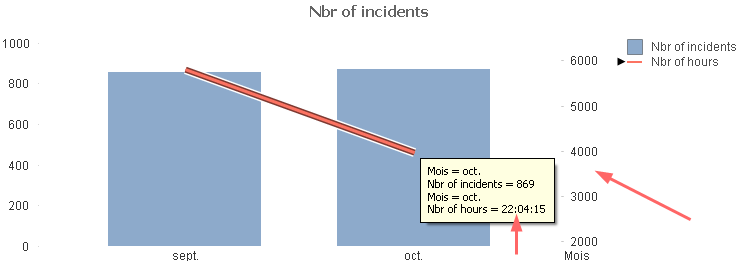
Do you know how can I do this ?
Thanks lot 
- Mark as New
- Bookmark
- Subscribe
- Mute
- Subscribe to RSS Feed
- Permalink
- Report Inappropriate Content
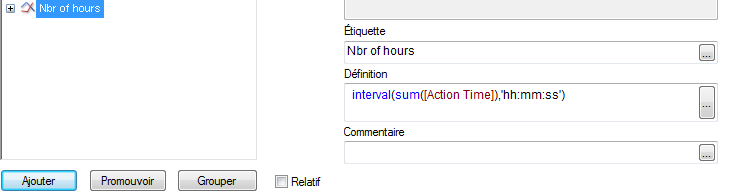
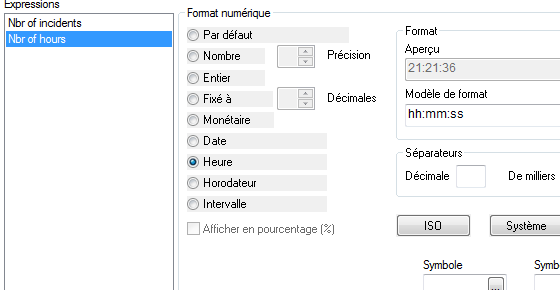
The Time function can only return a value between 0:00:00 and 23:59:59. If in your chart you sum hours then you should use the Interval function: interval(sum([Action Time]),'hh:mm:ss'). And you can change the number format on the Number tab. Check to option to override the expression default and choose the format you need and optionally change the format string as well.
talk is cheap, supply exceeds demand
- Mark as New
- Bookmark
- Subscribe
- Mute
- Subscribe to RSS Feed
- Permalink
- Report Inappropriate Content
Hi,
Thanks for your response.
Can I afford to show you my results ?
I change the definition here :
So I get this format :
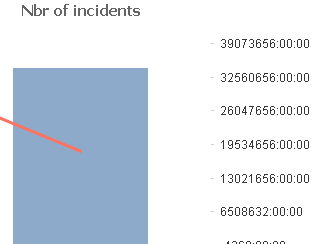
I go to number tab and choose "Hour"
But finally I get this :
Do you think it's a problem concerning my data ?
Thank you again.