Unlock a world of possibilities! Login now and discover the exclusive benefits awaiting you.
- Qlik Community
- :
- All Forums
- :
- QlikView App Dev
- :
- How can I create a table in a specific way I want?
- Subscribe to RSS Feed
- Mark Topic as New
- Mark Topic as Read
- Float this Topic for Current User
- Bookmark
- Subscribe
- Mute
- Printer Friendly Page
- Mark as New
- Bookmark
- Subscribe
- Mute
- Subscribe to RSS Feed
- Permalink
- Report Inappropriate Content
How can I create a table in a specific way I want?
Hi Everyone, I want to create a very simple and most common form of a table like below, but finding it difficult to create in QlikView. I want to create it at front end, and not at the script level.
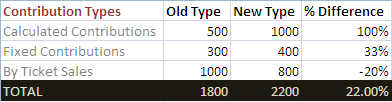
Here, Calculated Contributions, Fixed Contributions and By Ticket Sales are the dimensions I want. Please note that these three dimensions are not the fields in the table which I have loaded.
Old Type, New Type and % Difference are the expressions showing sums.
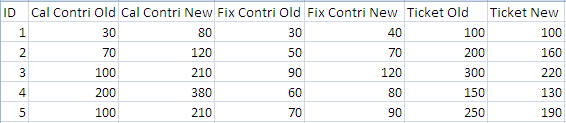
The table which is loaded in to the QlikView is like as below
It will be really helpful for me if I get a way to do this.
Thanks and Regards.
Accepted Solutions
- Mark as New
- Bookmark
- Subscribe
- Mute
- Subscribe to RSS Feed
- Permalink
- Report Inappropriate Content
QN,
You can create your dimensions as a value list
=valuelist('Calculated Contributions, 'Fixed Contributions', 'By Ticket Sales')
Your expression would then be
pick (match(valuelist('Calculated Contribution','Fixed Contribution','By Ticket Sales'), ,'Fixed Contribution','By Ticket Sales')
,Expression for Calculated Contibution
,Expression for Fixed Contribution
,Expression for By Ticket Sales)
Hope this helps,
Rich D
- Mark as New
- Bookmark
- Subscribe
- Mute
- Subscribe to RSS Feed
- Permalink
- Report Inappropriate Content
You need create some type of pivot table with three columns
ContribType, OldVal, NewVal
Calculated contr 30 80
Calculated contr 70 120
...
Fix Contributions 30 40
in sql it looks like
select 'Contrib contr' col2, col3
union all
select 'Fix Contributions' col4, col5
- Mark as New
- Bookmark
- Subscribe
- Mute
- Subscribe to RSS Feed
- Permalink
- Report Inappropriate Content
Thanks Valdimir, I tried it using Pivot table, but didn't succeed particularly to show in a way I want. I have created the expression coloumns, but I faced problem in creating dimensions I have mentioned. I want all the three dimensions in a single column, then there will be three columns for three expressions. I want exactly the same as I have shown above. There are thousands of entries, and dont want to show them. I just want to show the sum as above.
Best Regards
- Mark as New
- Bookmark
- Subscribe
- Mute
- Subscribe to RSS Feed
- Permalink
- Report Inappropriate Content
I mentioned pivot table. but it's not type of chart. You need transform your table in load script.
Solving this problem with expressions is realy difficult like for me
- Mark as New
- Bookmark
- Subscribe
- Mute
- Subscribe to RSS Feed
- Permalink
- Report Inappropriate Content
QN,
You can create your dimensions as a value list
=valuelist('Calculated Contributions, 'Fixed Contributions', 'By Ticket Sales')
Your expression would then be
pick (match(valuelist('Calculated Contribution','Fixed Contribution','By Ticket Sales'), ,'Fixed Contribution','By Ticket Sales')
,Expression for Calculated Contibution
,Expression for Fixed Contribution
,Expression for By Ticket Sales)
Hope this helps,
Rich D
- Mark as New
- Bookmark
- Subscribe
- Mute
- Subscribe to RSS Feed
- Permalink
- Report Inappropriate Content
Thanks Richard.
It worked perfectly fine and helped me a lot.
I have implemented in a way you specified, but I had faced problem while showing the TOTAL row. I tried by checking the "Show Partial Sums" on the "Presentation" tab, but it didnt work.
So ultimately, I implemented the TOTAL row in a same way as other rows with all the calculations for showing totals.
Best Regards