Unlock a world of possibilities! Login now and discover the exclusive benefits awaiting you.
- Qlik Community
- :
- All Forums
- :
- QlikView App Dev
- :
- Re: How can generate this report?
- Subscribe to RSS Feed
- Mark Topic as New
- Mark Topic as Read
- Float this Topic for Current User
- Bookmark
- Subscribe
- Mute
- Printer Friendly Page
- Mark as New
- Bookmark
- Subscribe
- Mute
- Subscribe to RSS Feed
- Permalink
- Report Inappropriate Content
How can generate this report?
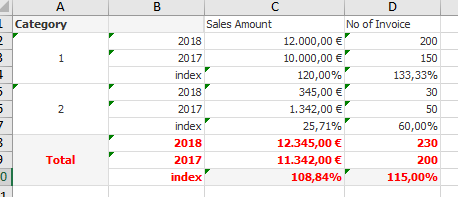
Please, any suggestion how can we calculate this report in this format.
Thank you.
Accepted Solutions
- Mark as New
- Bookmark
- Subscribe
- Mute
- Subscribe to RSS Feed
- Permalink
- Report Inappropriate Content
Script:
Island_Table:
Load * Inline [
    dim
    1
    2
    ];

Table1:
LOAD * inline [
Year,    Amount,    Invoice    , Category
2018,    12000,    200    ,1
2018,    345,    30    ,2
2017,    10000,    150    ,1
2017,    1342,    50    ,2
];
Pivot:
Dimension1
=pick(dim,Category,'Total')
Textformat Dimension1
=if(pick(dim,Category,'Total')='Total','<B>')
Textcolor Dimension1
=if(pick(dim,Category,'Total')='Total',LightRed())
Dimension2
=ValueList($(vMaxYear),$(vMaxYearBef),'index')
Textcolor Dimension2
=if(pick(dim,Category,'Total')='Total',LightRed())
Textformat Dimension2
=if(pick(dim,Category,'Total')='Total','<B>')
Textformat Expression1
=if(pick(dim,Category,'Total')='Total','<B>')
Textcolor Expression1
=if(pick(dim,Category,'Total')='Total',LightRed())
Textformat Expression2
=if(pick(dim,Category,'Total')='Total','<B>')
Textcolor Expression2
=if(pick(dim,Category,'Total')='Total',LightRed())
Sort Tab:
first expression:
Numeric Value Descending
second expression:
State: Ascending
Text A->Z
Presentation Tab:
deselect "Show Partial Sums"
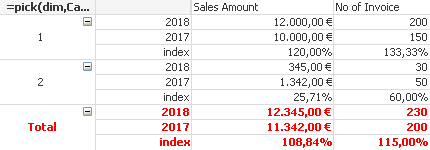
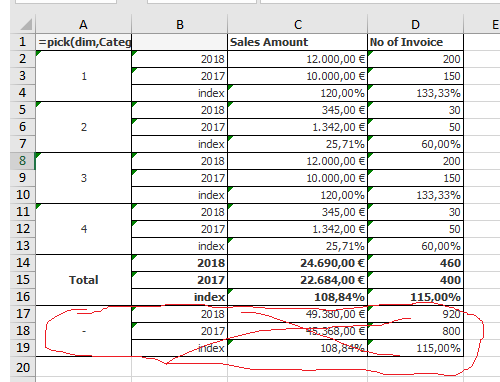
Output:
- Mark as New
- Bookmark
- Subscribe
- Mute
- Subscribe to RSS Feed
- Permalink
- Report Inappropriate Content
Script:
Island_Table:
Load * Inline [
    dim
    1
    2
    ];

Table1:
LOAD * inline [
Year,    Amount,    Invoice    , Category
2018,    12000,    200    ,1
2018,    345,    30    ,2
2017,    10000,    150    ,1
2017,    1342,    50    ,2
];
Pivot:
Dimension1
=pick(dim,Category,'Total')
Textformat Dimension1
=if(pick(dim,Category,'Total')='Total','<B>')
Textcolor Dimension1
=if(pick(dim,Category,'Total')='Total',LightRed())
Dimension2
=ValueList($(vMaxYear),$(vMaxYearBef),'index')
Textcolor Dimension2
=if(pick(dim,Category,'Total')='Total',LightRed())
Textformat Dimension2
=if(pick(dim,Category,'Total')='Total','<B>')
Textformat Expression1
=if(pick(dim,Category,'Total')='Total','<B>')
Textcolor Expression1
=if(pick(dim,Category,'Total')='Total',LightRed())
Textformat Expression2
=if(pick(dim,Category,'Total')='Total','<B>')
Textcolor Expression2
=if(pick(dim,Category,'Total')='Total',LightRed())
Sort Tab:
first expression:
Numeric Value Descending
second expression:
State: Ascending
Text A->Z
Presentation Tab:
deselect "Show Partial Sums"
Output:
- Mark as New
- Bookmark
- Subscribe
- Mute
- Subscribe to RSS Feed
- Permalink
- Report Inappropriate Content
Hi,
one solution that does not require changing your data model might be:
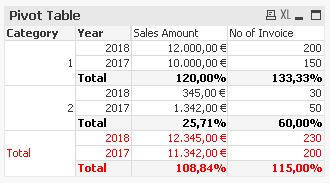
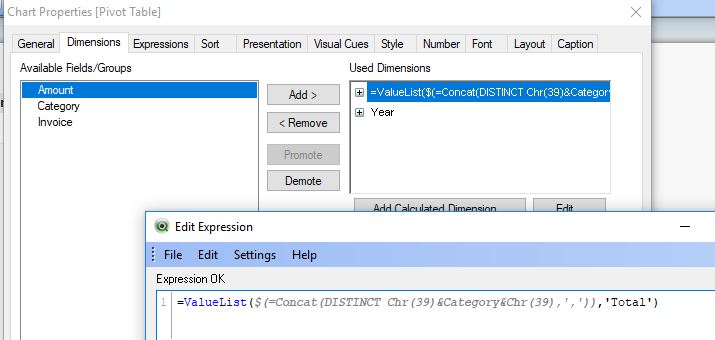
=ValueList($(=Concat(DISTINCT Chr(39)&Category&Chr(39),',')),'Total')
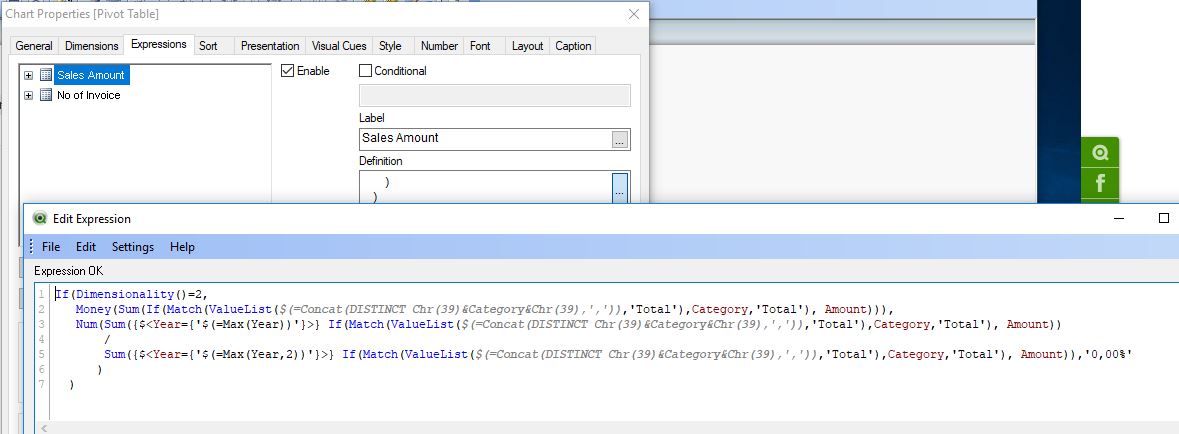
If(Dimensionality()=2,
   Money(Sum(If(Match(ValueList($(=Concat(DISTINCT Chr(39)&Category&Chr(39),',')),'Total'),Category,'Total'), Amount))),
   Num(Sum({$<Year={'$(=Max(Year))'}>} If(Match(ValueList($(=Concat(DISTINCT Chr(39)&Category&Chr(39),',')),'Total'),Category,'Total'), Amount))
       /
       Sum({$<Year={'$(=Max(Year,2))'}>} If(Match(ValueList($(=Concat(DISTINCT Chr(39)&Category&Chr(39),',')),'Total'),Category,'Total'), Amount)),'0,00%'
      )
  )
hope this helps
regards
Marco
- Mark as New
- Bookmark
- Subscribe
- Mute
- Subscribe to RSS Feed
- Permalink
- Report Inappropriate Content
Thank you Frank Hartmann for your answer, but if I have more than one category I'm showing a new blank line.
Do you have any idea how to remove this line?
Thank you.
- Mark as New
- Bookmark
- Subscribe
- Mute
- Subscribe to RSS Feed
- Permalink
- Report Inappropriate Content
What happens if you supress null values for the first dimension in the dimension tab?
- Mark as New
- Bookmark
- Subscribe
- Mute
- Subscribe to RSS Feed
- Permalink
- Report Inappropriate Content
Exactly, if I uncheck the Suppress When Value field is Null, the empty line is deleted.
Thank you once again for help.