Unlock a world of possibilities! Login now and discover the exclusive benefits awaiting you.
- Qlik Community
- :
- All Forums
- :
- QlikView App Dev
- :
- How can i take distinct values in summary expressi...
- Subscribe to RSS Feed
- Mark Topic as New
- Mark Topic as Read
- Float this Topic for Current User
- Bookmark
- Subscribe
- Mute
- Printer Friendly Page
- Mark as New
- Bookmark
- Subscribe
- Mute
- Subscribe to RSS Feed
- Permalink
- Report Inappropriate Content
How can i take distinct values in summary expression
Hello
I have a database that has
date , store , hour , sales
01/02/2015 , 101 , 19 , 10000
some times brings a second record with another sales amount
date , store , hour , sales
01/02/2015 , 101 , 19 , 10000
01/02/2015 , 101 , 19 , 15000
how can i take only the first record in a chart with the expression sum(sales)
I attached a qvw file.
Thank you in advance
- Mark as New
- Bookmark
- Subscribe
- Mute
- Subscribe to RSS Feed
- Permalink
- Report Inappropriate Content
one solution could be;
- add a field in the load to identify first record by date,store,hour
- the chart expression is sum({$ <id={1}>} sales)
load *, AutoNumber(rowno(),date&'-'&store&'-'&hour) as id
inline [
date,store,hour,sales
01/02/2015,101,21,10000
01/02/2015,102,21,15000
01/02/2015,103,21,20000
01/02/2015,101,21,30000
];
- Mark as New
- Bookmark
- Subscribe
- Mute
- Subscribe to RSS Feed
- Permalink
- Report Inappropriate Content
Hello Massimo.
The problem is that the database has more than 3 million records and the process takes too long to complete the reload with autonumber . Is there any other way with expression formula to take only these values ?
- Mark as New
- Bookmark
- Subscribe
- Mute
- Subscribe to RSS Feed
- Permalink
- Report Inappropriate Content
yes auto.... is slow
I tried in another way, this is the script, 5 millions of record, 75 sec
// test data
a:
load
rowno() as id,
date(makedate(2015)+floor(rand()*30)) as date,
101 + floor(rand()*10) as store,
floor(rand()*24) as hour,
floor(rand()*100000) as sales
autogenerate 5000000;
b:
NoConcatenate load
*,
if(store<>Peek(store) or hour<>Peek(hour) or date<>Peek(date),1,0) as flagfirst
//AutoNumber(rowno(),date&'-'&store&'-'&hour) as flagfirst
Resident a
order by date,store,hour,id;
DROP Table a;
- Mark as New
- Bookmark
- Subscribe
- Mute
- Subscribe to RSS Feed
- Permalink
- Report Inappropriate Content
I don't understand where this script helps to avoid the duplicate records by date - store - hour.
- Mark as New
- Bookmark
- Subscribe
- Mute
- Subscribe to RSS Feed
- Permalink
- Report Inappropriate Content
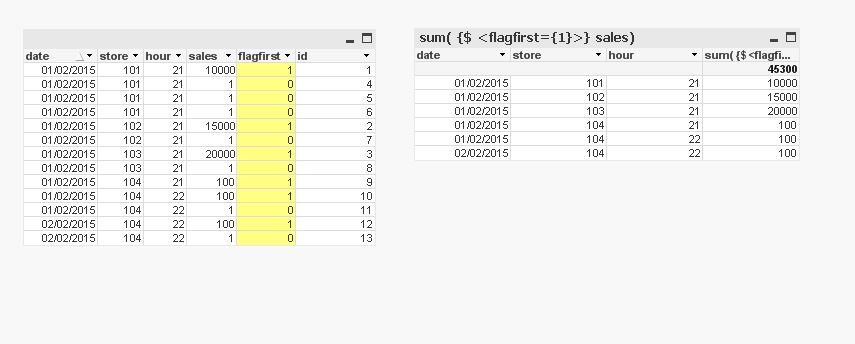
the script add a field, flagfirst, to your table to identify the distinct record by date - store - hour (1 = first record in table by date -store-hour, 0 duplicate)
the chart expression use set analysis sum( {$ <flagfirst={1}>} sales) to filter the distinct record by ...
SCRIPT
a:
load *, rowno() as id
inline [
date,store,hour,sales
01/02/2015,101,21,10000
01/02/2015,102,21,15000
01/02/2015,103,21,20000
01/02/2015,101,21,1
01/02/2015,101,21,1
01/02/2015,101,21,1
01/02/2015,102,21,1
01/02/2015,103,21,1
01/02/2015,104,21,100
01/02/2015,104,22,100
01/02/2015,104,22,1
02/02/2015,104,22,100
02/02/2015,104,22,1
];
b:
NoConcatenate load
*,
if(store<>Peek(store) or hour<>Peek(hour) or date<>Peek(date),1,0) as flagfirst
Resident a
order by date,store,hour,id;
DROP Table a;
RESULT
- Mark as New
- Bookmark
- Subscribe
- Mute
- Subscribe to RSS Feed
- Permalink
- Report Inappropriate Content