Unlock a world of possibilities! Login now and discover the exclusive benefits awaiting you.
- Qlik Community
- :
- All Forums
- :
- QlikView App Dev
- :
- How do I maintain records with a threshold in Pivo...
- Subscribe to RSS Feed
- Mark Topic as New
- Mark Topic as Read
- Float this Topic for Current User
- Bookmark
- Subscribe
- Mute
- Printer Friendly Page
- Mark as New
- Bookmark
- Subscribe
- Mute
- Subscribe to RSS Feed
- Permalink
- Report Inappropriate Content
How do I maintain records with a threshold in Pivot Tables?
Hopefully somebody out there can me.
I'll try to explain my problem as carefully as possible.
I have a pivot table with 2 Dimensions (A and B) and an expression.(C)
I want to use a threshold for the expression based on column A.
If column A satisfys the threshold then I want ALL the items in B to be shown so that the totals agree.
Please see the following which may explain my dilema better.
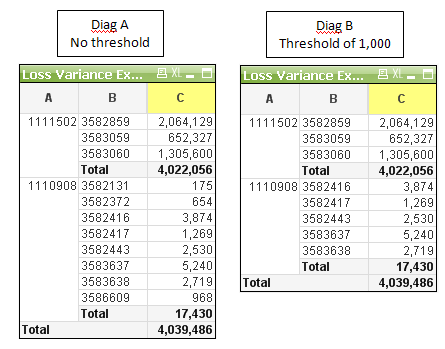
Unless The total for Column A is under the threshold, I want all of column B to be shown.
Any ideas?
- Mark as New
- Bookmark
- Subscribe
- Mute
- Subscribe to RSS Feed
- Permalink
- Report Inappropriate Content
Your Diag B image is not showing your expected result, right?
So if sum(C) for dimension A is above threshold, you want to show all dimension B values, but what if the threshold is not reached?
If you remove this Dimension A value completely, I think you can do it with a calculated dimension instead of A like
=aggr(if( sum(Value) > 1000 ,A),A)
where sum(Value) is to be replaced by your Expression C. Replace 1000 with your threshold, e.g. a variable $(vThreshold) )
If you need to show all dimension values for A, but you want to hide the details for B if the threshold is not reached, you can use a calculated dimension instead of B:
=aggr(if(sum(total<A> Value) > 1000, B,'Total'),A,B)
where sum(total<A> Value) needs to be replaced by your Expression C, using an additional total qualifier.
Hope this helps,
Stefan
- Mark as New
- Bookmark
- Subscribe
- Mute
- Subscribe to RSS Feed
- Permalink
- Report Inappropriate Content
Thanks for that Stefan but unfortunately I don't think I explained myself well enough.
B is a sub set of A.
The threshold is entered by the user to decide what A's they want to look at. They also want to see ALL of the B's that make up the A.
I have tried an "IF" statement but this works as Diag B above and takes out amounts I want to keep. ie it works on the B column and not the A column.
I then tried an aggregated statement
if(
FABS(aggr(Sum($(Amount)*(CLAIM)),A)) > Threshold
,
Sum($(Amount)*(CLAIM))
,
0
)
But this resulted in the total for A being shown correctly but zeros in the individual fields.
Any ideas?
- Mark as New
- Bookmark
- Subscribe
- Mute
- Subscribe to RSS Feed
- Permalink
- Report Inappropriate Content
Have you tried using a calculated dimension like mentioned above, not an expression?
=aggr(if( sum($(AMount)*(CLAIm) ) > Threshold ,A),A)
and check the 'suppress when Value is NULL' option in dimension tab.
- Mark as New
- Bookmark
- Subscribe
- Mute
- Subscribe to RSS Feed
- Permalink
- Report Inappropriate Content
Thanks, I'll come back to you on that,although the Pivot table is very much more complicated than the simple example I showed above.
Thanks
- Mark as New
- Bookmark
- Subscribe
- Mute
- Subscribe to RSS Feed
- Permalink
- Report Inappropriate Content
Thanks for your help Stephen.
Thought you might be interested tro know that I solved the problem using "Total"
if(FABS(sum(total <A> $(Amount)*(Claim))) > Threshold
,
Sum($(Amount)*(Claim))
,
0
)
Cheers
- Mark as New
- Bookmark
- Subscribe
- Mute
- Subscribe to RSS Feed
- Permalink
- Report Inappropriate Content
Hi,
If we want to also show negative amount like > and < how can we apply this here.