Unlock a world of possibilities! Login now and discover the exclusive benefits awaiting you.
- Qlik Community
- :
- All Forums
- :
- QlikView App Dev
- :
- How do I suppress future accumulations in a line/b...
- Subscribe to RSS Feed
- Mark Topic as New
- Mark Topic as Read
- Float this Topic for Current User
- Bookmark
- Subscribe
- Mute
- Printer Friendly Page
- Mark as New
- Bookmark
- Subscribe
- Mute
- Subscribe to RSS Feed
- Permalink
- Report Inappropriate Content
How do I suppress future accumulations in a line/bar chart?
Hi,
I'm sure their must be an easy was of doing this but...
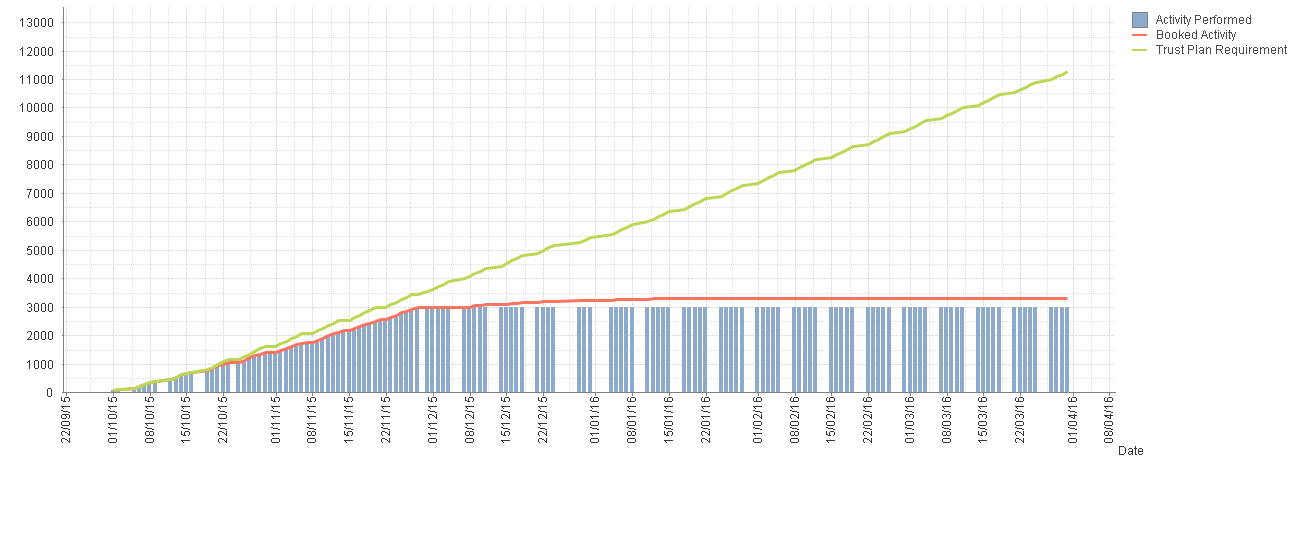
I am trying to compare activity that we want to happen against what we have done so far. I am accumlating the data for each days activity and using sum(activity) to calulate the results.
Unfortunately - by accumlating I am finding data that is now showing into the future. I have tried every thing I can thing of but cannot get rid of the future activity whilst maintaining the future forecast.
it currently looks like this... and I would like to get rid of all the blue bars from the point at which it flat lines.
- Mark as New
- Bookmark
- Subscribe
- Mute
- Subscribe to RSS Feed
- Permalink
- Report Inappropriate Content
May be restrict the sum(activity) using set analysis to show only data up till today.
- Mark as New
- Bookmark
- Subscribe
- Mute
- Subscribe to RSS Feed
- Permalink
- Report Inappropriate Content
Try to use set analysis combine with rangesum and show AMT to month you need.
if (sum ( {$<[Year] = {$(#=Only(vYY))}, [Month] = {"<=$(#=Only(vMM))"}>} [AMT]),
rangesum ( sum ( {$<[Year] = {$(#=Only(vYY))}, [Month] = {"<=$(#=Only(vMM))"}>} [AMT]),
above("Actual")
))