Unlock a world of possibilities! Login now and discover the exclusive benefits awaiting you.
- Qlik Community
- :
- All Forums
- :
- QlikView App Dev
- :
- Re: How to add multiple time zones to x-axis of ch...
- Subscribe to RSS Feed
- Mark Topic as New
- Mark Topic as Read
- Float this Topic for Current User
- Bookmark
- Subscribe
- Mute
- Printer Friendly Page
- Mark as New
- Bookmark
- Subscribe
- Mute
- Subscribe to RSS Feed
- Permalink
- Report Inappropriate Content
How to add multiple time zones to x-axis of chart?
Need to add IST, GMT and EST formats to show different time zones on x-axis.
9/11/17 Update:
trying to add an input box with the options: IST, EST, and GMT.
Time on the x-axis will then be calculated depending on the selection. To do so, I attempted to add a calculated dimension:
=ConvertToLocalTime(Hour,
if(vTimeZone= 'IST','GMT+09:30',
if(vTimeZone= 'EST','GMT',
if(vTimeZone='GMT','GMT+05:00'))))
Note:
vTimeZone is a Variable

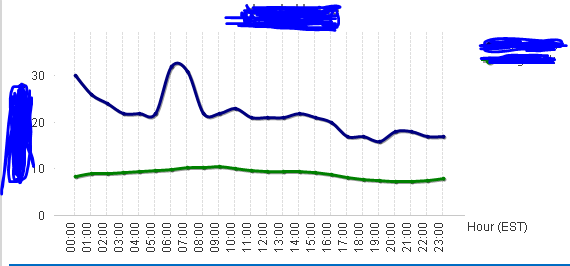
Hour is a field seen in the chart above already in EST.

This expression is not working- any ideas?
Accepted Solutions
- Mark as New
- Bookmark
- Subscribe
- Mute
- Subscribe to RSS Feed
- Permalink
- Report Inappropriate Content
Correct code:
Note-
found out hour contained both numeric and string values
= ConvertToLocalTime( IF(IsNum(Hour), TIME(Hour),TIME#(Hour,'hh:mm')),
If(vTimeZone = 'IST', 'GMT+09:00',
If(vTimeZone = 'EST', 'GMT+00:00',
If(vTimeZone = 'GMT', 'GMT+05:00',
)))
)
- Mark as New
- Bookmark
- Subscribe
- Mute
- Subscribe to RSS Feed
- Permalink
- Report Inappropriate Content
You can add one more time zone by creating an expression that calculates the hour (relative to EST, your x-axis) and using the "Text on Axis" display option for the Expression.
-Rob
- Mark as New
- Bookmark
- Subscribe
- Mute
- Subscribe to RSS Feed
- Permalink
- Report Inappropriate Content
Correct code:
Note-
found out hour contained both numeric and string values
= ConvertToLocalTime( IF(IsNum(Hour), TIME(Hour),TIME#(Hour,'hh:mm')),
If(vTimeZone = 'IST', 'GMT+09:00',
If(vTimeZone = 'EST', 'GMT+00:00',
If(vTimeZone = 'GMT', 'GMT+05:00',
)))
)