Unlock a world of possibilities! Login now and discover the exclusive benefits awaiting you.
- Qlik Community
- :
- All Forums
- :
- QlikView App Dev
- :
- How to calculate rolling Avg over month in a Pivot...
- Subscribe to RSS Feed
- Mark Topic as New
- Mark Topic as Read
- Float this Topic for Current User
- Bookmark
- Subscribe
- Mute
- Printer Friendly Page
- Mark as New
- Bookmark
- Subscribe
- Mute
- Subscribe to RSS Feed
- Permalink
- Report Inappropriate Content
How to calculate rolling Avg over month in a Pivot Table with multiple dimensions along with time dimension as well
Hi All ,
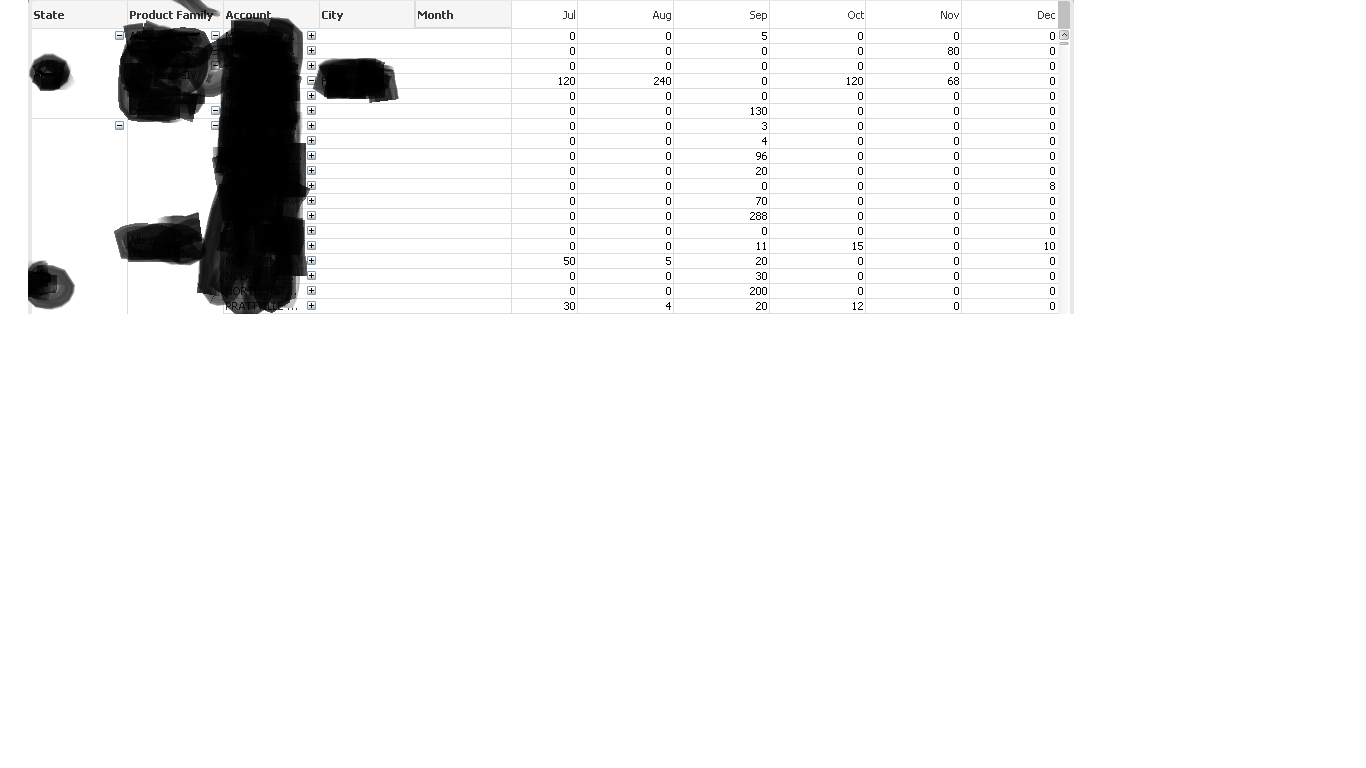
I have a pivot table with 4 dim along with time dimension as well and expression showing sum of sales. I need to add another expression in the table against the latest /current month only which shows rolling Avg of sales including current month from the start of year ie Jan. I have tries rangeavg but that is not giving me desired result.Request you all to please help asap.I have attached the screenshot of the the Table where i need to insert the required column at the last showing the rolling avg. Please let me know if i need to put any further information in this.
- Mark as New
- Bookmark
- Subscribe
- Mute
- Subscribe to RSS Feed
- Permalink
- Report Inappropriate Content
Hi,
I think, If we add the expression in the pivot table it will give the separate column for each month (because your month field in top).
If you just need the average, you can try to use aggregation. Like..
=Avg(aggr(sum(sales),State,[Product Family],Account,City,Month))
Note: Enable the 'Show partial Sums' for Month Dimension in the Presentation Tab.
- Mark as New
- Bookmark
- Subscribe
- Mute
- Subscribe to RSS Feed
- Permalink
- Report Inappropriate Content
Hi Settu ,
Thanks for your help. I had tried this option but the problem with is that Avg is appearing against each column.
Is there anyway i can hide all those and show only final avg. Also i don't want to show total quantity as well (however i can bear with that).
The next problem I have that I need to compare the rolling avg with the current month sale to decide its colour as Red or Green.
Even if I put the month on the side along with other dimensions will it be possible to compare the rolling avg. for current year with the current month sale or not ?
I have pasted the screenshot below and encircled the values which i need to compare.
Please note i have shown current month as Aug as i have data available till Aug only so i need to compare Aug sale with the rolling Avg of current Year.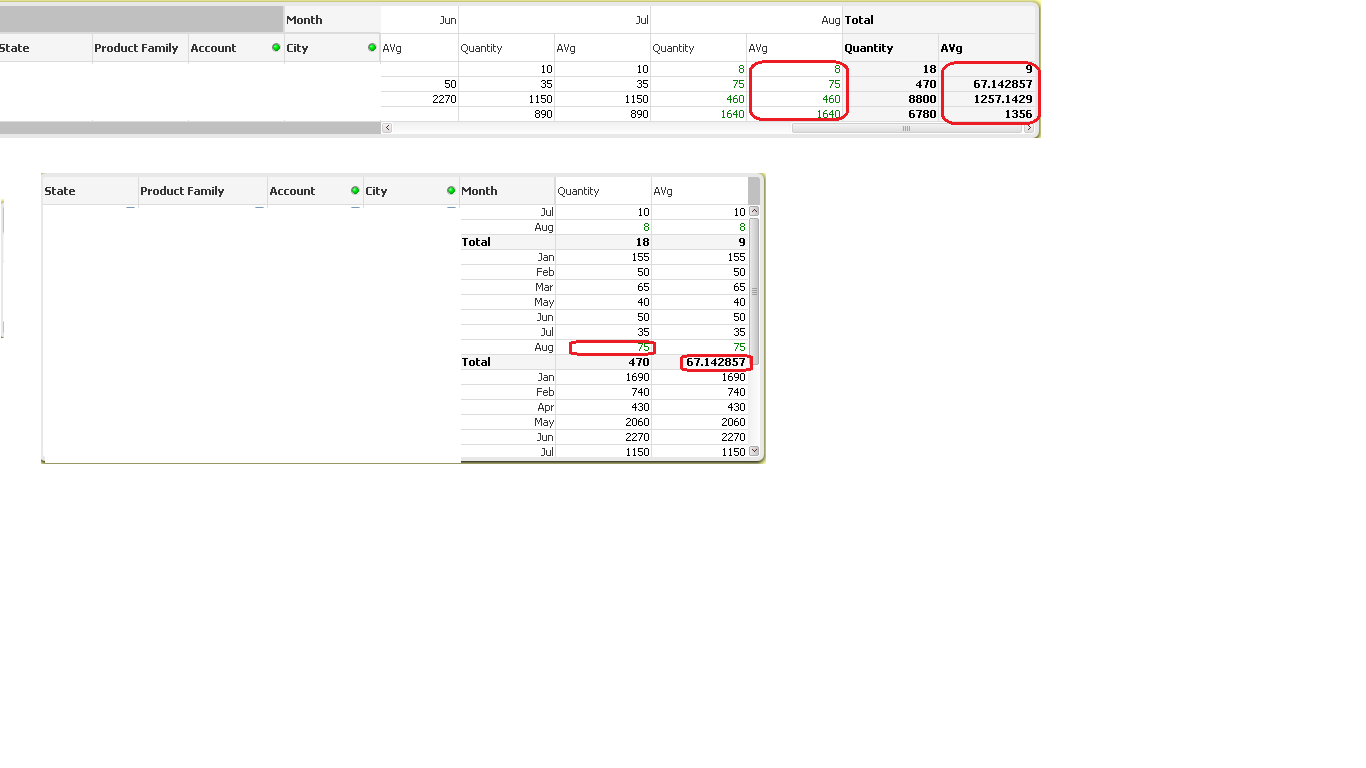
- Mark as New
- Bookmark
- Subscribe
- Mute
- Subscribe to RSS Feed
- Permalink
- Report Inappropriate Content
hi,
Kindly have alook at this post.
I think this should help you..
Calculating rolling n-period totals, averages or other aggregations
Regards,
Bhavini S Mehta.
- Mark as New
- Bookmark
- Subscribe
- Mute
- Subscribe to RSS Feed
- Permalink
- Report Inappropriate Content
I would suggest go through these posting, which will be helpful for you:
Calculating rolling n-period totals, averages or other aggregations
- Mark as New
- Bookmark
- Subscribe
- Mute
- Subscribe to RSS Feed
- Permalink
- Report Inappropriate Content
Can you post some sample data?
- Mark as New
- Bookmark
- Subscribe
- Mute
- Subscribe to RSS Feed
- Permalink
- Report Inappropriate Content
Hi,
Remove your existing expression, try what i suggested..your chart shoud have one expression only..
If possible, post sample data..