Unlock a world of possibilities! Login now and discover the exclusive benefits awaiting you.
- Qlik Community
- :
- All Forums
- :
- QlikView App Dev
- :
- Re: How to calculate the expression for every poss...
- Subscribe to RSS Feed
- Mark Topic as New
- Mark Topic as Read
- Float this Topic for Current User
- Bookmark
- Subscribe
- Mute
- Printer Friendly Page
- Mark as New
- Bookmark
- Subscribe
- Mute
- Subscribe to RSS Feed
- Permalink
- Report Inappropriate Content
How to calculate the expression for every possible value of the dimension in a chart?
Hi all,
I'm trying to create a chart where the expression is calculated separately for every value of the chart's dimension.
Dimension: DimMonths (ranging from 1 to 100, generated with AutoGenerate)
Expression: Count( {< ActiveMonths = {">=$(=DimMonths)"} >} Customer) / Count( {< PotentialMonths = {">=$(=DimMonths)"} >} Customer)
End result should look like this:
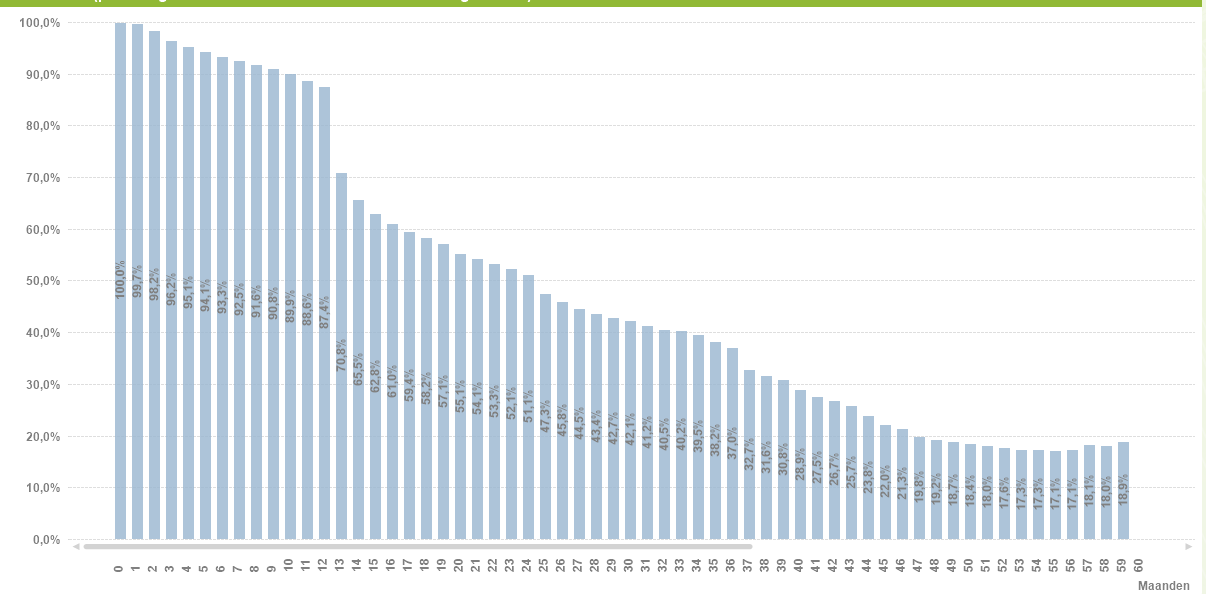
The above expression obviously doesn't work, because Qlikview does not calculate the expression for all possible values of DimMonths. I made it work with an nested IF-statement, but with 100+ distinct values this is obviously terrible for performance, readability and maintenance:
IF(DimMonths = 0,COUNT( {< ActiveMonths = {">=0"} >} Customer) / COUNT( {< PotentialMonths = {">=0"} >} Customer),
IF(DimMonths = 1,COUNT( {< ActiveMonths = {">=1"} >} Customer) / COUNT( {< PotentialMonths = {">=1"} >} Customer),
IF(DimMonths = 2,COUNT( {< ActiveMonths = {">=2"} >} Customer) / COUNT( {< PotentialMonths = {">=2"} >} Customer),
Etc...
Etc...
Does anyone know a better solution?
-----------------------------------------------------------------
Here is some (simplified) sample data:
DimMonths:
LOAD RecNo() AS DimMonths
AUTOGENERATE(5);
| Customer | ContractStart | ContractEnd | PotentialMonths (= Nov16– ContractStart) | ActiveMonths (= ISNULL(ContractEnd,Nov16) – ContractStart) |
|---|---|---|---|---|
| A | June16 | - | 5 | 5 |
| B | June16 | Sep16 | 5 | 3 |
| C | Juli16 | Okt16 | 4 | 3 |
| D | Juli16 | - | 4 | 4 |
| E | Aug16 | Sep16 | 3 | 1 |
| F | Aug16 | Okt16 | 3 | 2 |
| G | Sep16 | - | 2 | 2 |
| H | Sep16 | - | 2 | 2 |
| I | Okt16 | - | 1 | 1 |
| J | Okt16 | Okt16 | 1 | 0 |
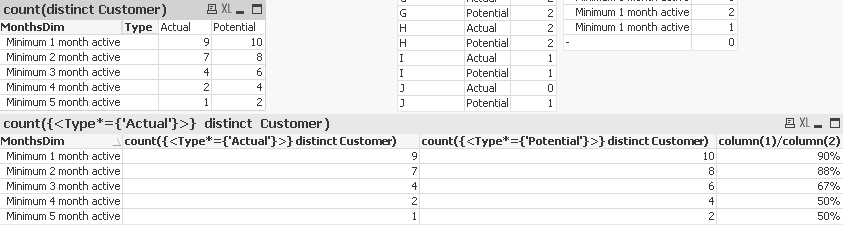
I'm looking for an expression that gives me this result. I cannot make the calculations in the load script, because the graph needs to be responsive to other dimensions.
| Active | Potential | Rest | |
|---|---|---|---|
| Minimal 1 month active | 9 | 10 | 90% |
| Minimal 2 month active | 7 | 8 | 88% |
| Minimal 3 month active | 4 | 6 | 66% |
| Minimal 4 month active | 2 | 4 | 50% |
| Minimal 5 month active | 1 | 2 | 50% |
- « Previous Replies
-
- 1
- 2
- Next Replies »
Accepted Solutions
- Mark as New
- Bookmark
- Subscribe
- Mute
- Subscribe to RSS Feed
- Permalink
- Report Inappropriate Content
I would do it almost exactly like Jakub suggests, but instead of converting my main table, I'd have the table he shows be an additional table, because I figure we still want to track contract start and end dates, and I don't want those repeated on the new table.
See attached.
Months:
CROSSTABLE (Type,Months)
LOAD
Customer
,PotentialMonths as Potential
,ActualMonths as Actual
RESIDENT Customers
;
AsOf:
LOAD *
,dual('Minimum ' & (Months+1-iterno()) & ' month active',Months+1-iterno()) as MonthsDim
WHILE Months+1-iterno() > 0
;
LOAD iterno() as Months
WHILE iterno() <= Max
;
LOAD max(fieldvalue('Months',recno())) as Max
AUTOGENERATE fieldvaluecount('Months')
;
- Mark as New
- Bookmark
- Subscribe
- Mute
- Subscribe to RSS Feed
- Permalink
- Report Inappropriate Content
Would you be able to share a sample?
- Mark as New
- Bookmark
- Subscribe
- Mute
- Subscribe to RSS Feed
- Permalink
- Report Inappropriate Content
Count( {< ActiveMonths >= {"DimMonths"} >} Customer) / Count( {< PotentialMonths >= {"DimMonths"} >} Customer)
--> this is wrong I think
you could try this:
Count( {< ActiveMonths = {">=$(=only(DimMonths))"} >} Customer) / Count( {< PotentialMonths = {">=$(=only(DimMonths))"} >} Customer)
- Mark as New
- Bookmark
- Subscribe
- Mute
- Subscribe to RSS Feed
- Permalink
- Report Inappropriate Content
Hi Sunny T, i added some (simplified) sample data to the original post
- Mark as New
- Bookmark
- Subscribe
- Mute
- Subscribe to RSS Feed
- Permalink
- Report Inappropriate Content
Hi Robin, thanks for your suggestion!
Obviously my expression had incorrect syntax, i changed that in my original post. The problem with this solution is that DimMonths only works in set analysis when it is a unique value or a variable. But because DimMonths is my dimension, it is different for every row and the expression should be recalculated for every row with a different value of DimMonths. Set analysis doesn't do that (i'm not sure, but that's what i read on this community), so I'm looking for a way around it...
- Mark as New
- Bookmark
- Subscribe
- Mute
- Subscribe to RSS Feed
- Permalink
- Report Inappropriate Content
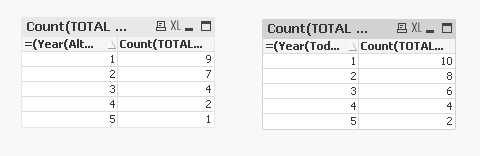
I am able to get the two numbers in two separate charts, but having a hard time putting them together in one chart. May be somebody else have a better idea....
- Mark as New
- Bookmark
- Subscribe
- Mute
- Subscribe to RSS Feed
- Permalink
- Report Inappropriate Content
Im trying this solution now. It is complex but it works, however performance isn't any better than a nested-if solution (with my 60 months x 500.000 rows)
- Mark as New
- Bookmark
- Subscribe
- Mute
- Subscribe to RSS Feed
- Permalink
- Report Inappropriate Content
Let us know if you find a solution. I would be eager to know if there is a way to do this. Also, we might be able to seek the expert's help if you run into any issue johnw
Best,
Sunny
- Mark as New
- Bookmark
- Subscribe
- Mute
- Subscribe to RSS Feed
- Permalink
- Report Inappropriate Content
You could solve it with some data modelling, I think.
Consider having your main table in this form:
| Customer | Months | PotentialFlag |
|---|---|---|
| A | 5 | Potential |
| A | 4 | Active |
| B | 1 | Potential |
| B | 1 | Active |
| C | 2 | Potential |
| C | 0 | Active |
| ... | ... | ... |
Then, have another table in this form ("100" is a placeholder for what the maximum number in Months column is - it's easy enough to get it after you load all the data in the above table, and generate the whole thing below automatically with Autogenerate and While):
| MonthsDim | Months |
|---|---|
| 100 | 100 |
| 99 | 100 |
| 99 | 99 |
| 98 | 100 |
| 98 | 99 |
| 98 | 98 |
| ... | ... |
(it's kinda like a table that would connect months to YTD months, only in reverse  )
)
With such a data model, use MonthsDim as dimension, and your formulas will become pretty simple:
COUNT( {< PotentialFlag = {'Active'} >} Customer) / COUNT( {< PotentialFlag = {'Potential'} >} Customer)
This is not precalculating anything - just linking data differently - so selections will keep working.
Of course, whether you can use this suggestion or not depends on the rest of your data model. But maybe you can adapt it 
- Mark as New
- Bookmark
- Subscribe
- Mute
- Subscribe to RSS Feed
- Permalink
- Report Inappropriate Content
I would do it almost exactly like Jakub suggests, but instead of converting my main table, I'd have the table he shows be an additional table, because I figure we still want to track contract start and end dates, and I don't want those repeated on the new table.
See attached.
Months:
CROSSTABLE (Type,Months)
LOAD
Customer
,PotentialMonths as Potential
,ActualMonths as Actual
RESIDENT Customers
;
AsOf:
LOAD *
,dual('Minimum ' & (Months+1-iterno()) & ' month active',Months+1-iterno()) as MonthsDim
WHILE Months+1-iterno() > 0
;
LOAD iterno() as Months
WHILE iterno() <= Max
;
LOAD max(fieldvalue('Months',recno())) as Max
AUTOGENERATE fieldvaluecount('Months')
;
- « Previous Replies
-
- 1
- 2
- Next Replies »