Unlock a world of possibilities! Login now and discover the exclusive benefits awaiting you.
- Qlik Community
- :
- All Forums
- :
- QlikView App Dev
- :
- How to capture metrics changes?
- Subscribe to RSS Feed
- Mark Topic as New
- Mark Topic as Read
- Float this Topic for Current User
- Bookmark
- Subscribe
- Mute
- Printer Friendly Page
- Mark as New
- Bookmark
- Subscribe
- Mute
- Subscribe to RSS Feed
- Permalink
- Report Inappropriate Content
How to capture metrics changes?
Hi All,
I have 3 dimensions and one metric. I am trying to capture the number of times the value changed by each dimension.
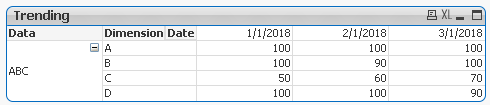
In this screen shot, I am using Pivot table. Data, Dimension and Date are my dimensions and Using one metric.
If I select Dimension - A, it has 0 changes (100 across 3 dates).
If I select Dimension - B, it has 2 changes (100 to 90 and 90 to 100)
If I select Dimension - C, it has 2 changes (50 to 60 and 60 to 70)
If I select Dimension - D, it has 1 change (100 to 90)
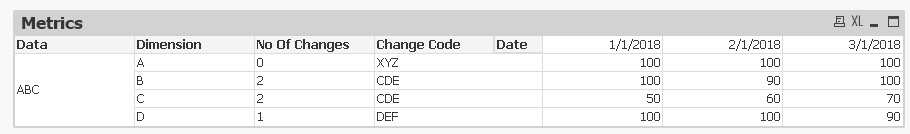
Based on the number of value changes, I am trying to Create a dimension.
If number of changes =0, then XYZ
If number of changes = 1, then DEF
If number of changes = 2, then CDE
Attaching the sample dataset and the QVW file.
Can anyone please help me with this?
Thanks,
Varun
Accepted Solutions
- Mark as New
- Bookmark
- Subscribe
- Mute
- Subscribe to RSS Feed
- Permalink
- Report Inappropriate Content
- Mark as New
- Bookmark
- Subscribe
- Mute
- Subscribe to RSS Feed
- Permalink
- Report Inappropriate Content
Do you want to achieve at front end or back end?
- Mark as New
- Bookmark
- Subscribe
- Mute
- Subscribe to RSS Feed
- Permalink
- Report Inappropriate Content
Anything is fine
- Mark as New
- Bookmark
- Subscribe
- Mute
- Subscribe to RSS Feed
- Permalink
- Report Inappropriate Content
Hi Manish,
Anything that is feasible and achievable.
- Mark as New
- Bookmark
- Subscribe
- Mute
- Subscribe to RSS Feed
- Permalink
- Report Inappropriate Content
Have a look at the attached file.
output:
- Mark as New
- Bookmark
- Subscribe
- Mute
- Subscribe to RSS Feed
- Permalink
- Report Inappropriate Content
Hi Krishna,
Thanks for the response.
Cheers,
Varun
- Mark as New
- Bookmark
- Subscribe
- Mute
- Subscribe to RSS Feed
- Permalink
- Report Inappropriate Content
Hi Krishna,
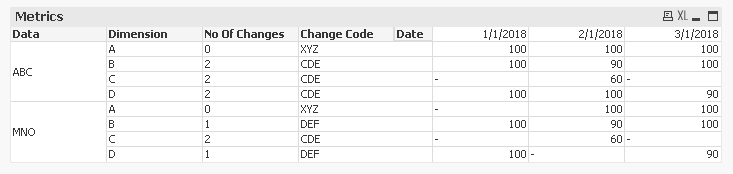
Previously we had one Data value, this is working fine. When I add multiple, this is not working as expected. I tried to add Data to the aggregations.
For ABC and Dimension D, we see count as 2. It should be 1.
For MNO and Dimension A, we see count as 0, which should be 1.
Can you please help me with this?
Updated file has been attached.
Thanks,
Varun