Unlock a world of possibilities! Login now and discover the exclusive benefits awaiting you.
- Qlik Community
- :
- All Forums
- :
- QlikView App Dev
- :
- How to convert BarChart to BlockChart ?
- Subscribe to RSS Feed
- Mark Topic as New
- Mark Topic as Read
- Float this Topic for Current User
- Bookmark
- Subscribe
- Mute
- Printer Friendly Page
- Mark as New
- Bookmark
- Subscribe
- Mute
- Subscribe to RSS Feed
- Permalink
- Report Inappropriate Content
How to convert BarChart to BlockChart ?
hi to all ,
i have usual BarChart with year dimension and 2 measurs, looks like that :
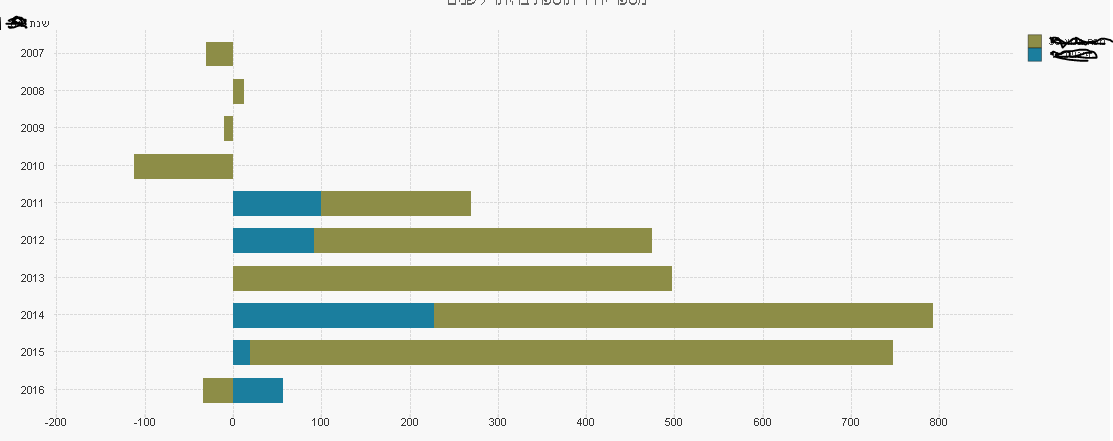
i need to convert it to BlockChart , with 2 parts with the 2 colors blue and green ( i dont need to see the year )
, how can i do this ? thanks ?
- Tags:
- barchart blockchart
- « Previous Replies
-
- 1
- 2
- Next Replies »
Accepted Solutions
- Mark as New
- Bookmark
- Subscribe
- Mute
- Subscribe to RSS Feed
- Permalink
- Report Inappropriate Content
- Mark as New
- Bookmark
- Subscribe
- Mute
- Subscribe to RSS Feed
- Permalink
- Report Inappropriate Content
can u share sample app?
- Mark as New
- Bookmark
- Subscribe
- Mute
- Subscribe to RSS Feed
- Permalink
- Report Inappropriate Content
here it is , Similar to the first example :
thanks.
- Mark as New
- Bookmark
- Subscribe
- Mute
- Subscribe to RSS Feed
- Permalink
- Report Inappropriate Content
is this?
- Mark as New
- Bookmark
- Subscribe
- Mute
- Subscribe to RSS Feed
- Permalink
- Report Inappropriate Content
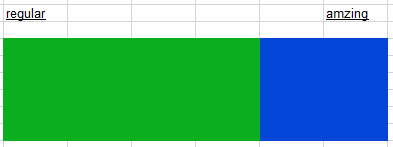
no Chanty , I NEED SOMETHING THAT LOOKS SIMPLE LIKE :
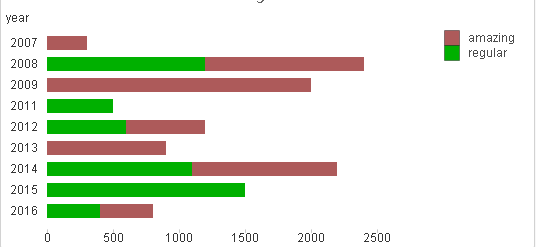
NOT COMPLICATE LIKE ( years of regular ) :
- 1 BlockChart - 2 parts ONLY  .
.
- Mark as New
- Bookmark
- Subscribe
- Mute
- Subscribe to RSS Feed
- Permalink
- Report Inappropriate Content
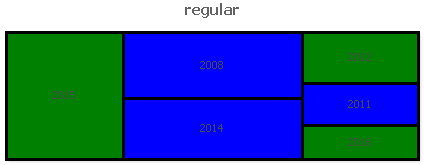
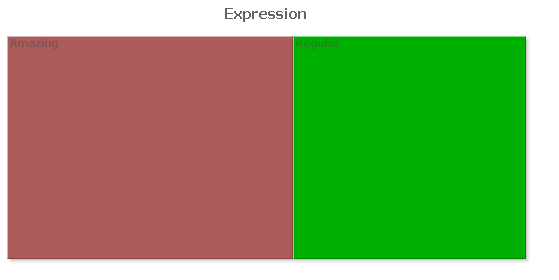
like this?
- Mark as New
- Bookmark
- Subscribe
- Mute
- Subscribe to RSS Feed
- Permalink
- Report Inappropriate Content
In addition, if you would like to make selection in one of those blocks, then ValueList() as dimension won't work, in that case you can create an Island Inline table in the script and use that as your dimension:
Table:
LOAD year,
regular,
amazing,
amount
FROM
Community_211021.xls
(biff, embedded labels, table is Sheet1$);
Dim:
LOAD * Inline [
Dim
1
2
];
Dimension: Dim
Expression: (Same as what Kush has provided) just using Dim
=Pick(Dim,
Sum({$<regular={1}>}amount),
Sum({$<amazing={1}>}amount))
If not selection would be necessary you should be good using Kush's solution 
- Mark as New
- Bookmark
- Subscribe
- Mute
- Subscribe to RSS Feed
- Permalink
- Report Inappropriate Content
looks like you love the PICK function
- Mark as New
- Bookmark
- Subscribe
- Mute
- Subscribe to RSS Feed
- Permalink
- Report Inappropriate Content

- Mark as New
- Bookmark
- Subscribe
- Mute
- Subscribe to RSS Feed
- Permalink
- Report Inappropriate Content
I have been using it more often then not for situations like these ever since I have learnt their use from you Kush
- « Previous Replies
-
- 1
- 2
- Next Replies »