Unlock a world of possibilities! Login now and discover the exclusive benefits awaiting you.
- Qlik Community
- :
- All Forums
- :
- QlikView App Dev
- :
- How to create an average line over 2 dimensions?
Options
- Subscribe to RSS Feed
- Mark Topic as New
- Mark Topic as Read
- Float this Topic for Current User
- Bookmark
- Subscribe
- Mute
- Printer Friendly Page
Turn on suggestions
Auto-suggest helps you quickly narrow down your search results by suggesting possible matches as you type.
Showing results for
Not applicable
2015-01-26
09:35 PM
- Mark as New
- Bookmark
- Subscribe
- Mute
- Subscribe to RSS Feed
- Permalink
- Report Inappropriate Content
How to create an average line over 2 dimensions?
Hi,
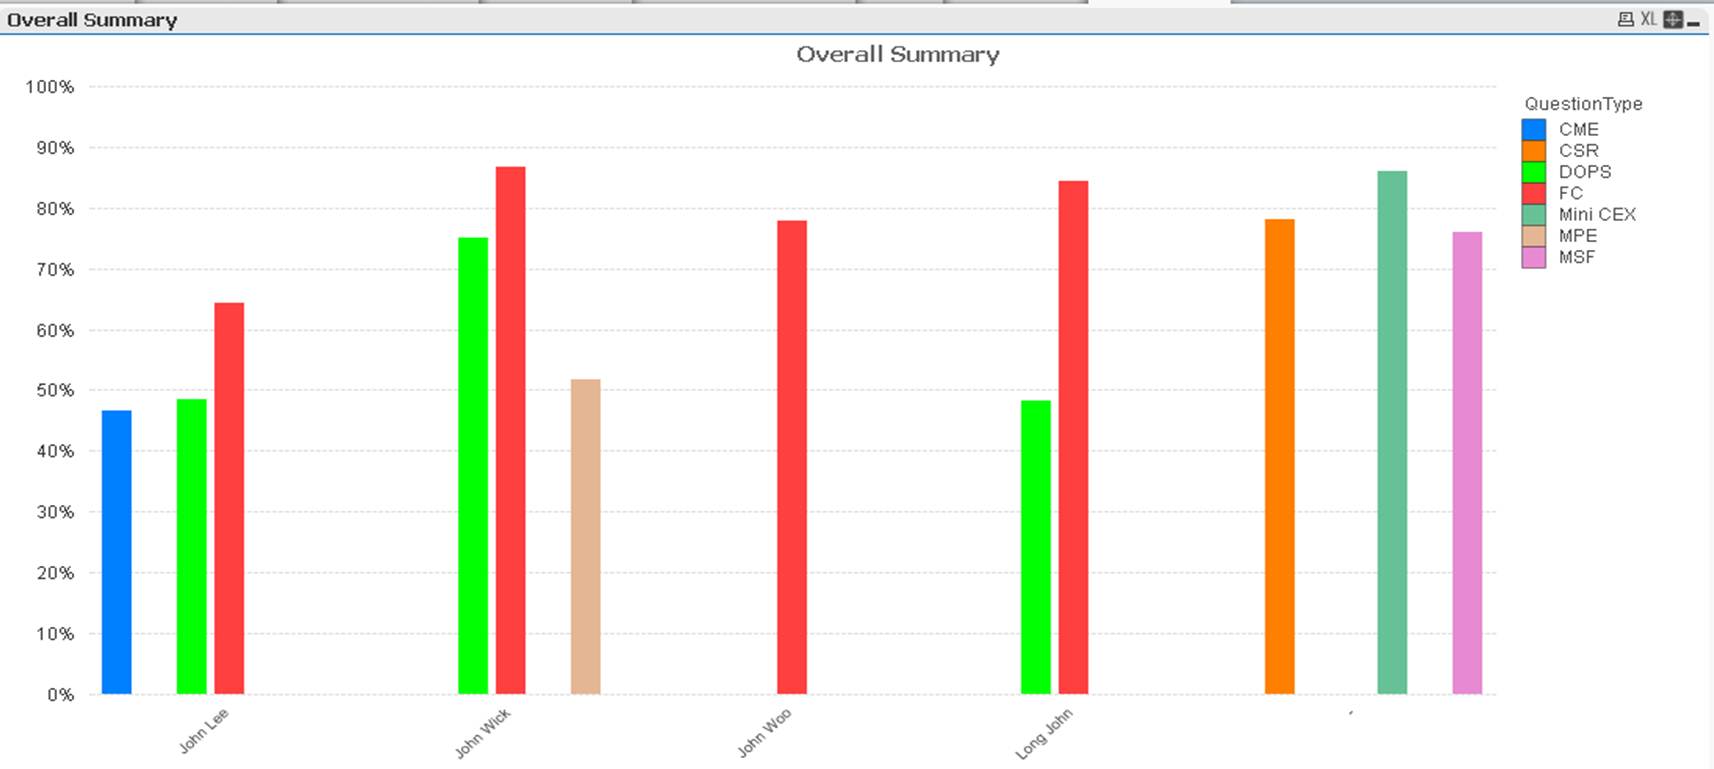
I am trying to create an average score per QuestionType per student/ resident. However, whenever I put in one more expression (the average score), the chart legend changes which is not what I want.
Below are the screenshot to explain:
The below chart is the chart I need to show, only lacking is an average of all the question types grouped by per resident.
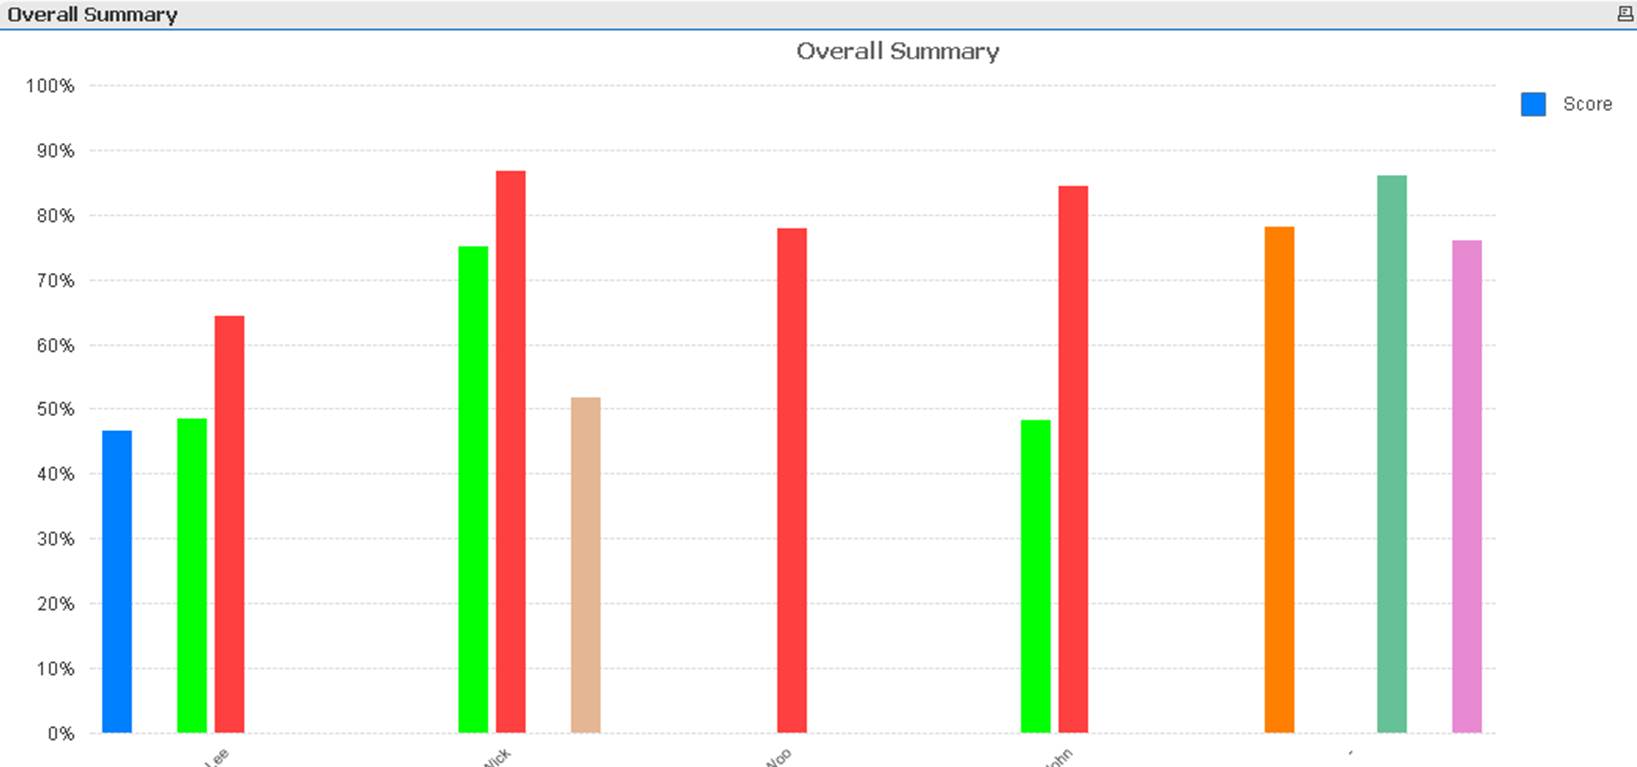
Second screenshot shows that my QuestionType changed to score when I put in average line expression.
How should i put in my average line so that the chart will remain as if shown in screenshot 1.
thanks!
189 Views
0 Replies