Unlock a world of possibilities! Login now and discover the exclusive benefits awaiting you.
- Qlik Community
- :
- All Forums
- :
- QlikView App Dev
- :
- Re: How to display the latest record only?
- Subscribe to RSS Feed
- Mark Topic as New
- Mark Topic as Read
- Float this Topic for Current User
- Bookmark
- Subscribe
- Mute
- Printer Friendly Page
- Mark as New
- Bookmark
- Subscribe
- Mute
- Subscribe to RSS Feed
- Permalink
- Report Inappropriate Content
How to display the latest record only?
Hi All,
I have data like this:
Code Date Value
1 20130617 10
1 20130617 20
1 20130617 30
2 20130617 100
2 20130617 150
2 20130617 200
Now in my straight tabe, I need to dislay the latest Value from above, i.e
Code Date Value
1 20130617 30
2 20130617 200
Please advice on how to achieve this?
Thanks
Accepted Solutions
- Mark as New
- Bookmark
- Subscribe
- Mute
- Subscribe to RSS Feed
- Permalink
- Report Inappropriate Content
Good idea Anders, that gives the correct result:
Dmohanty: remove date dimension, add max(date) as an expression and you're good to go.
Best,
Matt
- Mark as New
- Bookmark
- Subscribe
- Mute
- Subscribe to RSS Feed
- Permalink
- Report Inappropriate Content
Ho do you define 'latest'? All records show the same date, is there also a timestamp you can use?
Or are you looking at the record number?
Then create a record number field in your load script:
LOAD
Code,
Date,
Value,
RecNo() as RecNr
FROM ...;
Then, in your chart table with dimension Code, use two expressions:
=FirstSortedValue(Date, -RecNr)
=FirstSortedValue(Value, -RecNr)
If your Date is actually a timestamp you can use, make sure your timestamp is a QV timestamp with a numeric representation, and replace RecNr with your Date / Timestamp field in above two expressions.
- Mark as New
- Bookmark
- Subscribe
- Mute
- Subscribe to RSS Feed
- Permalink
- Report Inappropriate Content
Here's same solution Swuehl proposes using row(), but as he said, if your date includes a timestamp you should be able to use it.
Best,
Matt
- Mark as New
- Bookmark
- Subscribe
- Mute
- Subscribe to RSS Feed
- Permalink
- Report Inappropriate Content
Hi Swuehl,
Thanks for initiating help. Unfortuantely directly I can't use the RecNo() in the load, as the fields are coming from different table. Can it be done where the fields are loaded as Resident?
I can use this expression: FirstSortedValue(Date, -Value). It works fine.
But at the same case, I have two different dates for a single Code. In that case the above expression showing the latest value, instead of pickking the value for latest date.
Suppose, I have
Code Date Value
10 20130617 10
10 20130617 20
10 20130617 30
10 20130617 100
10 20130617 150
10 20130618 200
Now the above expression shows 150, rather than 200.
So, in a big case I have data like this:
Code Date Value
10 20130617 10
10 20130617 20
10 20130617 30
10 20130617 100
10 20130617 250
10 20130618 200
1 20130617 10
1 20130617 20
1 20130617 30
2 20130617 100
2 20130617 150
2 20130617 200
So the output would be
Code Date Value
10 20130618 200
1 20130617 30
2 20130617 200
If I use FirstSortedValue(Date, -Value), the output comes as
10 20130618 250
1 20130617 30
2 20130617 250
- Mark as New
- Bookmark
- Subscribe
- Mute
- Subscribe to RSS Feed
- Permalink
- Report Inappropriate Content
Thanks Mattsies for quick suggestion,
Suppose I did like this:
load *
,RowNo( )
Inline
[
Code , Date, Value
10 , 20130617, 10
10, 20130617 , 20
10, 20130617 , 30
10, 20130617 , 100
10, 20130617 , 250
10, 20130618 , 200
1, 20130617, 10
1 , 20130617, 20
1 , 20130617, 30
2 , 20130617, 100
2 , 20130617, 150
2 , 20130617, 200
];
And in the chart, I get this:
| Code | Date | =FirstSortedValue(Value,-[RowNo( )]) |
| 200 | ||
| 1 | 20130617 | 30 |
| 2 | 20130617 | 200 |
| 10 | 20130617 | 250 |
| 10 | 20130618 | 200 |
Where, I dont need the 3rd row now....here for code 10, latest value is 200.
So, I expect the data like this:
| Code | Date | =FirstSortedValue(Value,-[RowNo( )]) |
| 1 | 20130617 | 30 |
| 2 | 20130617 | 200 |
| 10 | 20130618 | 200 |
Please help on this.
- Mark as New
- Bookmark
- Subscribe
- Mute
- Subscribe to RSS Feed
- Permalink
- Report Inappropriate Content
You are using Date as second dimension, right?
Remove that dimension and use an expression instead:
=FirstSortedValue(Date, -[RowNo()])
- Mark as New
- Bookmark
- Subscribe
- Mute
- Subscribe to RSS Feed
- Permalink
- Report Inappropriate Content
Yes Swuehl, removing the Date as dimension and using the expression =FirstSortedValue(Value,-[RowNo( )]) gives me result like this:
| Code | =FirstSortedValue(Value,-[RowNo( )]) |
| 1 | 30 |
| 2 | 200 |
| 10 | 200 |
But still I need Date as the dimension.  How to proceed? Please some suggestions..
- Mark as New
- Bookmark
- Subscribe
- Mute
- Subscribe to RSS Feed
- Permalink
- Report Inappropriate Content
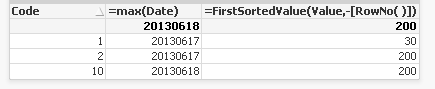
add the expression max(Date). that should give you the max date per Code
- Mark as New
- Bookmark
- Subscribe
- Mute
- Subscribe to RSS Feed
- Permalink
- Report Inappropriate Content
Good idea Anders, that gives the correct result:
Dmohanty: remove date dimension, add max(date) as an expression and you're good to go.
Best,
Matt