Unlock a world of possibilities! Login now and discover the exclusive benefits awaiting you.
- Qlik Community
- :
- All Forums
- :
- QlikView App Dev
- :
- How to filter automatically a chart or table?
- Subscribe to RSS Feed
- Mark Topic as New
- Mark Topic as Read
- Float this Topic for Current User
- Bookmark
- Subscribe
- Mute
- Printer Friendly Page
- Mark as New
- Bookmark
- Subscribe
- Mute
- Subscribe to RSS Feed
- Permalink
- Report Inappropriate Content
How to filter automatically a chart or table?
Hi,
I will like to display a chart for last 6 months, 12 months, 3 months, I have performed this manually:
=Count({$<YR_Cal={2016}, Month={">06"} >} AutoID)
Each month, I should update this expression. How can I update the expression to have the same result, each month automatically, I mean that I don't need to update the expression and it will be calculated automatically.
I have fields as YYYY-MM, Fiscal Year-Quarter (FYYYYY-Q#), created date (full date).
Thank's in advanced for your help.
- Tags:
- date filter
- « Previous Replies
- Next Replies »
- Mark as New
- Bookmark
- Subscribe
- Mute
- Subscribe to RSS Feed
- Permalink
- Report Inappropriate Content
How about this:
=MaxString({1}FYQTR)
- Mark as New
- Bookmark
- Subscribe
- Mute
- Subscribe to RSS Feed
- Permalink
- Report Inappropriate Content
Allocated memory exceeded, but the idea is to display the count of ids for the highest FYQTR
- Mark as New
- Bookmark
- Subscribe
- Mute
- Subscribe to RSS Feed
- Permalink
- Report Inappropriate Content
Can you share sample or few screenshots?
- Mark as New
- Bookmark
- Subscribe
- Mute
- Subscribe to RSS Feed
- Permalink
- Report Inappropriate Content
This is what I am getting, but using this expression: =Count({$<YR={2017}, QTR={">=01"} >} AutoID)
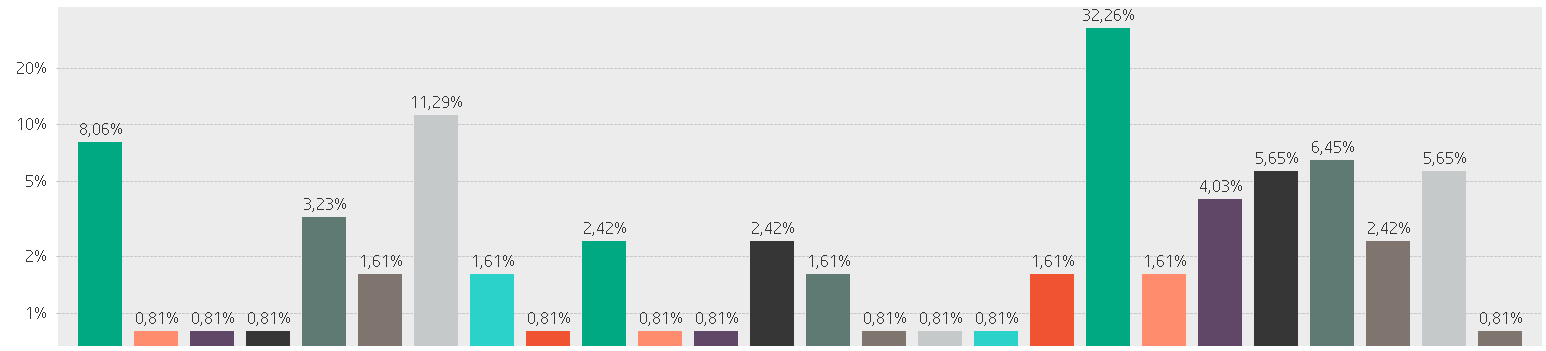
The idea is that it will be calculated automatically, I mean, that when the QTR is 2 then it display the 2017 q2, and that I don't need to change it manually.
- Mark as New
- Bookmark
- Subscribe
- Mute
- Subscribe to RSS Feed
- Permalink
- Report Inappropriate Content
I get that, but do can I see your field FYQTR?
- Mark as New
- Bookmark
- Subscribe
- Mute
- Subscribe to RSS Feed
- Permalink
- Report Inappropriate Content
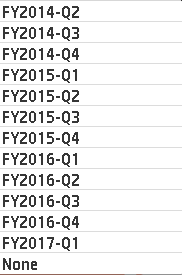
Those are the values available
- Mark as New
- Bookmark
- Subscribe
- Mute
- Subscribe to RSS Feed
- Permalink
- Report Inappropriate Content
It should have worked, but I don't really know the complexities of your app. Unless you can share your app, I might not be able to help you with this
- « Previous Replies
- Next Replies »