Unlock a world of possibilities! Login now and discover the exclusive benefits awaiting you.
- Qlik Community
- :
- All Forums
- :
- QlikView App Dev
- :
- How to fix the X-Axis of a chart when its values a...
- Subscribe to RSS Feed
- Mark Topic as New
- Mark Topic as Read
- Float this Topic for Current User
- Bookmark
- Subscribe
- Mute
- Printer Friendly Page
- Mark as New
- Bookmark
- Subscribe
- Mute
- Subscribe to RSS Feed
- Permalink
- Report Inappropriate Content
How to fix the X-Axis of a chart when its values are changed?
Hi there,
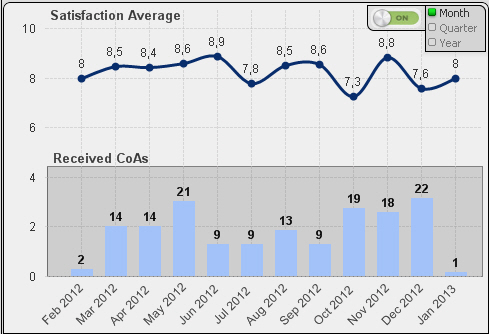
I have a chart which shows the average customer satisfaction and the amount of ratings per month / quarter / year.
As it is a combined chart (see screenshot) it did not use the drill down feature in the dimension tab but variables to switch between month, quarter and year.
Everything works as desired but as "Feb 2012" or "2012 / Q3" is longer than "2012" my x-axis is moving up an down as the text on the axis is changing. Usually it is not a that big problem but my second chart (the smaller one with the darker background) is fixed and so the x-axis of the small chart and the main chart are no longer on the same level. Is there any way to fix the x-axis so that it does not move up or down?
- Mark as New
- Bookmark
- Subscribe
- Mute
- Subscribe to RSS Feed
- Permalink
- Report Inappropriate Content
Hi,
You should try to play with "CTRL + SHIFT" to resize the graph, it will fix the axis label heigth.