Unlock a world of possibilities! Login now and discover the exclusive benefits awaiting you.
- Qlik Community
- :
- All Forums
- :
- QlikView App Dev
- :
- How to get a trend line equation?
- Subscribe to RSS Feed
- Mark Topic as New
- Mark Topic as Read
- Float this Topic for Current User
- Bookmark
- Subscribe
- Mute
- Printer Friendly Page
- Mark as New
- Bookmark
- Subscribe
- Mute
- Subscribe to RSS Feed
- Permalink
- Report Inappropriate Content
How to get a trend line equation?
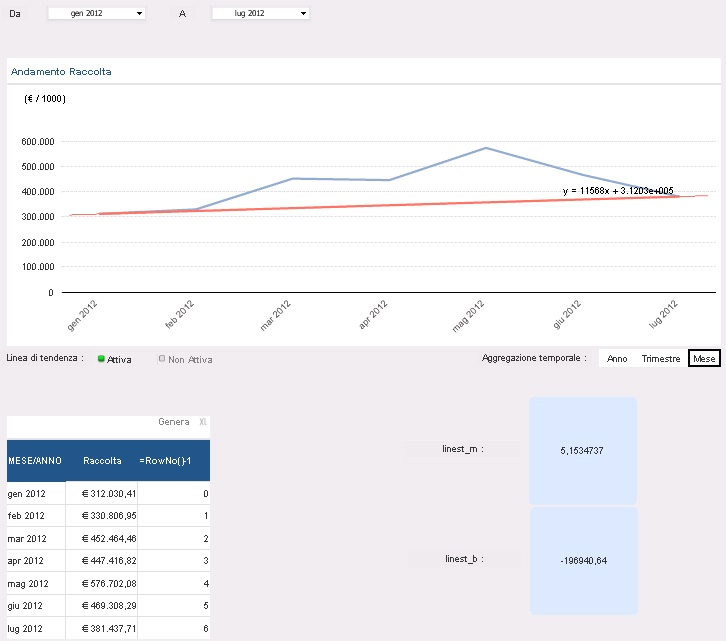
I have a chart with two expressions, the first one is the main expression (blue line) and the other one is a customized trend line, basically a line which links the first value at "gen 2012" to the last value at "lug 2012". In order to show the equation of the red line I activated the trend line on the second expression and checked the "show equation" option. The user can select the range of months so the X values in the chart are dynamic, and that's the reason why I used the rowNo() function to get the X value (in order to make the equation work I have to assume that "gen 2012" is X=0 and "lug 2012" is X=7).
What I need to do is to get the m and the b values of the line (m=11568, b=312030). I tried to use the linest_m and linest_b functions in this form:
linest_m(total aggr(Y,X),X)
linest_b(total aggr(Y,X),X)
If I write RowNo() instead of the X all I obtain is a crash of QlikView. Do you know any solutions for it?