Unlock a world of possibilities! Login now and discover the exclusive benefits awaiting you.
- Qlik Community
- :
- All Forums
- :
- QlikView App Dev
- :
- Re: How to get average of two dimention in chart?
- Subscribe to RSS Feed
- Mark Topic as New
- Mark Topic as Read
- Float this Topic for Current User
- Bookmark
- Subscribe
- Mute
- Printer Friendly Page
- Mark as New
- Bookmark
- Subscribe
- Mute
- Subscribe to RSS Feed
- Permalink
- Report Inappropriate Content
How to get average of two dimention in chart?
Hi All
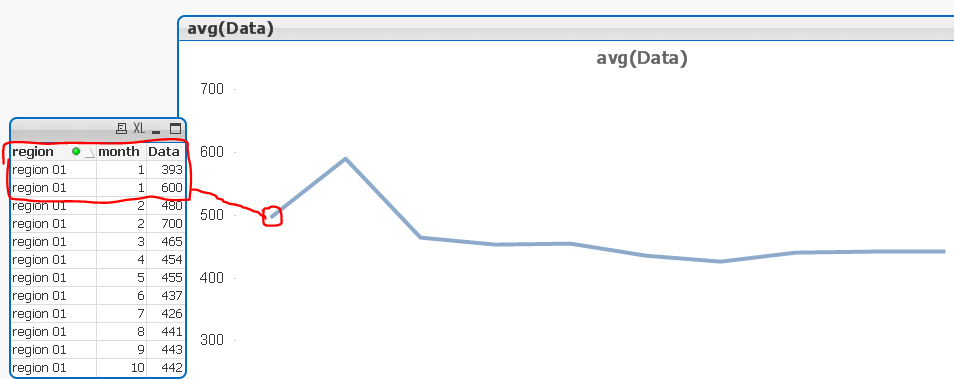
I have a line chart with 2 dimention month and region. and an expression average of data like below. I want to have an average line that be average of each region in each month.what should I do to get this?
- Mark as New
- Bookmark
- Subscribe
- Mute
- Subscribe to RSS Feed
- Permalink
- Report Inappropriate Content
hello marjan ,
we have function called column by using columns function achieved ur desired result.\
for eg
column(1)+column(2)/2
kindly try this in ur app
Thanks and regards,
Rohit lohani
- Mark as New
- Bookmark
- Subscribe
- Mute
- Subscribe to RSS Feed
- Permalink
- Report Inappropriate Content
Try clicking on the cyclical group to view both views
- Mark as New
- Bookmark
- Subscribe
- Mute
- Subscribe to RSS Feed
- Permalink
- Report Inappropriate Content
Hi,
in Your example data, you only have one region on each month. So if you use sum or avg as Expression doesent change anything here. Your linechart is showing you an average on each region on each month. If you add one more value for example on region 01 on month 1, then avg(Data) will gives you average for thoose 2 values on month 1.
otherwise give us some example on expected output.
- Mark as New
- Bookmark
- Subscribe
- Mute
- Subscribe to RSS Feed
- Permalink
- Report Inappropriate Content
No Its not my purpose
I want average of all region in each moth month. It should be a broken line.
- Mark as New
- Bookmark
- Subscribe
- Mute
- Subscribe to RSS Feed
- Permalink
- Report Inappropriate Content
I dont get it, but try if this Expression gives you correct output avg(total <region>Data)
- Mark as New
- Bookmark
- Subscribe
- Mute
- Subscribe to RSS Feed
- Permalink
- Report Inappropriate Content
Yes Its correct. But I want an average line that show average of all region in each month.for example average in month1 will be 266 and the average in month 2 will be 339.
- Mark as New
- Bookmark
- Subscribe
- Mute
- Subscribe to RSS Feed
- Permalink
- Report Inappropriate Content
Then you have to remove region as dimension
- Mark as New
- Bookmark
- Subscribe
- Mute
- Subscribe to RSS Feed
- Permalink
- Report Inappropriate Content
I want to get average from 2 dimensions