Unlock a world of possibilities! Login now and discover the exclusive benefits awaiting you.
- Qlik Community
- :
- All Forums
- :
- QlikView App Dev
- :
- How to get chart to display correct label, not the...
- Subscribe to RSS Feed
- Mark Topic as New
- Mark Topic as Read
- Float this Topic for Current User
- Bookmark
- Subscribe
- Mute
- Printer Friendly Page
- Mark as New
- Bookmark
- Subscribe
- Mute
- Subscribe to RSS Feed
- Permalink
- Report Inappropriate Content
How to get chart to display correct label, not the expression itself?
I need the x-axis to display the hours, not the expression itself.
For instance if vTimeZone= EST I want the x-axis to look like this:
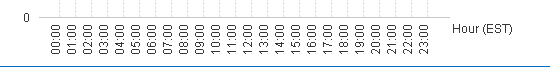
How can I make this change?
Update:
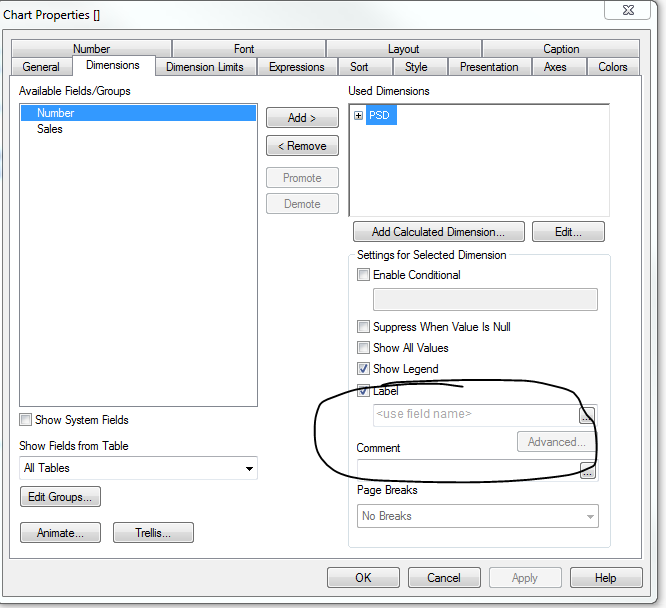
Under dimensions tab, I selected table then added the expression:
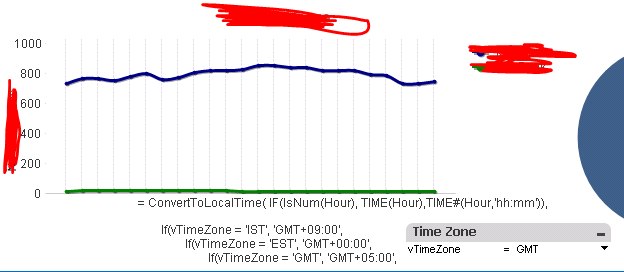
=ConvertToLocalTime(Hour,
if(vTimeZone= 'IST','GMT+09:30',
if(vTimeZone= 'EST','GMT',
if(vTimeZone='GMT','GMT+05:00'))))
Now the chart displays
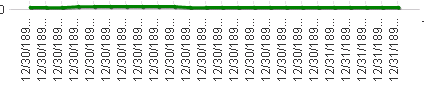
How can I just get it to display the time and not the date? Can I also have it labeled EST?
- « Previous Replies
-
- 1
- 2
- Next Replies »
Accepted Solutions
- Mark as New
- Bookmark
- Subscribe
- Mute
- Subscribe to RSS Feed
- Permalink
- Report Inappropriate Content
- Mark as New
- Bookmark
- Subscribe
- Mute
- Subscribe to RSS Feed
- Permalink
- Report Inappropriate Content
Try an expression like this for Label on the dimension tab
='Hour (' & vTimeZone & ')'
- Mark as New
- Bookmark
- Subscribe
- Mute
- Subscribe to RSS Feed
- Permalink
- Report Inappropriate Content
That works! but is there a way to get it only to display only the time and not the date?
- Mark as New
- Bookmark
- Subscribe
- Mute
- Subscribe to RSS Feed
- Permalink
- Report Inappropriate Content
May be like this
=Time(ConvertToLocalTime(Hour,
if(vTimeZone= 'IST','GMT+09:30',
if(vTimeZone= 'EST','GMT',
if(vTimeZone='GMT','GMT+05:00')))), 'hh:mm')
- Mark as New
- Bookmark
- Subscribe
- Mute
- Subscribe to RSS Feed
- Permalink
- Report Inappropriate Content
That displays the same results with the date and time
- Mark as New
- Bookmark
- Subscribe
- Mute
- Subscribe to RSS Feed
- Permalink
- Report Inappropriate Content
Can you share a sample to look at?
- Mark as New
- Bookmark
- Subscribe
- Mute
- Subscribe to RSS Feed
- Permalink
- Report Inappropriate Content
This is all I can provide:
Which is data for the hour field (listed in EST)

- Mark as New
- Bookmark
- Subscribe
- Mute
- Subscribe to RSS Feed
- Permalink
- Report Inappropriate Content
As an image? can you provide this in an Excel file?
- Mark as New
- Bookmark
- Subscribe
- Mute
- Subscribe to RSS Feed
- Permalink
- Report Inappropriate Content
Yes, here you go- thanks!
- Mark as New
- Bookmark
- Subscribe
- Mute
- Subscribe to RSS Feed
- Permalink
- Report Inappropriate Content
Seems to work for me

- « Previous Replies
-
- 1
- 2
- Next Replies »