Unlock a world of possibilities! Login now and discover the exclusive benefits awaiting you.
- Qlik Community
- :
- All Forums
- :
- QlikView App Dev
- :
- How to get field value to have dynamic set analysi...
- Subscribe to RSS Feed
- Mark Topic as New
- Mark Topic as Read
- Float this Topic for Current User
- Bookmark
- Subscribe
- Mute
- Printer Friendly Page
- Mark as New
- Bookmark
- Subscribe
- Mute
- Subscribe to RSS Feed
- Permalink
- Report Inappropriate Content
How to get field value to have dynamic set analysis?
I have this scenario, I have month Target Collection, and I also want to get the variance of THIS MONTH vs LAST MONTH.
Example:
| YYYYMM | Target Collection |
|---|---|
| 201501 | 500 |
| 201502 | 250 |
| 201503 | 1000 |
| 201504 | 850 |
So this is my desired report, I want it dynamically displayed data.
| YYYYMM | Target Collection | Increase / Decrease |
|---|---|---|
| 201501 | 500 | 0 |
| 201502 | 250 | -250 |
| 201503 | 1000 | 750 |
| 201504 | 850 | -150 |
The formula is simple as this, current month Target Collection minus previous month Target Collection.
Note that, I don't want to use Above() or other dependent formula. I want to use set analysis to have the data dynamically displayed.
Hope to hear feedback soonest.
Regards,
Bill
- Mark as New
- Bookmark
- Subscribe
- Mute
- Subscribe to RSS Feed
- Permalink
- Report Inappropriate Content
Hi,
If you don't want to use Above(), then you have to do this in script like below
Temp:
LOAD
Date(Date#(YYYYMM, 'YYYYMM')) AS Date,
YYYYMM,
TargetCollection,
TargetCollection - Previous(TargetCollection) AS IncDec
INLINE [
YYYYMM, TargetCollection
201501, 500
201502, 250
201503, 1000
201504, 850];
Now use Sum(IncDec) as your expression for your Increase / Decrease column.
Hope this helps you.
Regards,
jagan.
- Mark as New
- Bookmark
- Subscribe
- Mute
- Subscribe to RSS Feed
- Permalink
- Report Inappropriate Content
Hi Jagan,
This per account, that's why I want it to be dynamic. There are accounts not exist in previous months, there are also accounts not exist in current month.

- Mark as New
- Bookmark
- Subscribe
- Mute
- Subscribe to RSS Feed
- Permalink
- Report Inappropriate Content
Hi,
Try this script
Data:
LOAD
Date(Date#(YYYYMM, 'YYYYMM')) AS Date,
YYYYMM,
TargetCollection
INLINE [
YYYYMM, TargetCollection
201501, 500
201502, 250
201503, 1000
201504, 850];
JOIN (Data)
LOAD
MonthStart(Date, 1) AS Date,
TargetCollection AS PrevMonthTargetCollection
RESIDENT Data;
And use below expression in chart
Data:
LOAD
Date(Date#(YYYYMM, 'YYYYMM')) AS Date,
YYYYMM,
TargetCollection
INLINE [
YYYYMM, TargetCollection
201501, 500
201502, 250
201503, 1000
201504, 850];
JOIN (Data)
LOAD
MonthStart(Date, 1) AS Date,
TargetCollection AS PrevMonthTargetCollection
RESIDENT Data;
And use below expression in your chart
=Sum(TargetCollection) - Sum(PrevMonthTargetCollection)
Regards,
Jagan.
- Mark as New
- Bookmark
- Subscribe
- Mute
- Subscribe to RSS Feed
- Permalink
- Report Inappropriate Content
Hi
Use mapping load
Temp:
LOAD * INLINE [
YYYYMM,TargetCollection
201501,500
201502,250
201503,1000
201504,850
];
Map1:
Mapping LOAD YYYYMM,TargetCollection Resident Temp;
Temp1:
load YYYYMM, TargetCollection,ApplyMap ('Map1',Trim(Date(AddMonths(Date#(YYYYMM,'YYYYMM'),-1),'YYYYMM')),0 ) as PrevTargetCollection
Resident Temp ;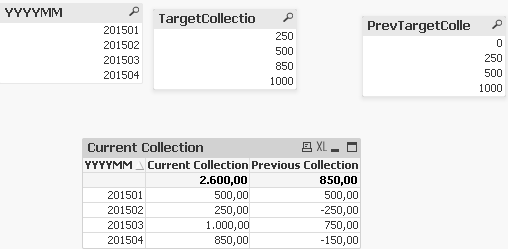
drop table Temp;
- Mark as New
- Bookmark
- Subscribe
- Mute
- Subscribe to RSS Feed
- Permalink
- Report Inappropriate Content
Hi Bill
I do not think what you want to achieve is possible with set analysis and you have to use script for it. Did you try the script options?
Sasi
- Mark as New
- Bookmark
- Subscribe
- Mute
- Subscribe to RSS Feed
- Permalink
- Report Inappropriate Content
I agree with SasiParupudi1 that it isn't possible with set analysis then for this you would be need a different calculation-condition for each cell whereas these conditions will be calculated at first global for the object and then applied for each row.
The above mentioned script-solutions looks like a very good approach and they will work. But could be possible to get these data dynamically with above(), too. Then you could pass the to grab row with the second and third parameter from above. You could try something like this:
above(sum(value), only(MonthCounter) - above(only(MonthCounter)))
Whereas MonthCounter is a continues counter for each month and will be created within a master-calendar which is connected to your date-fields from the fact-table. You will find here more about the master-calendar and MonthCounter: How to use - Master-Calendar and Date-Values.
- Marcus