Unlock a world of possibilities! Login now and discover the exclusive benefits awaiting you.
- Qlik Community
- :
- All Forums
- :
- QlikView App Dev
- :
- How to get the line chart Value as 500 After rest...
- Subscribe to RSS Feed
- Mark Topic as New
- Mark Topic as Read
- Float this Topic for Current User
- Bookmark
- Subscribe
- Mute
- Printer Friendly Page
- Mark as New
- Bookmark
- Subscribe
- Mute
- Subscribe to RSS Feed
- Permalink
- Report Inappropriate Content
How to get the line chart Value as 500 After restricting the x-axis up to 300(Static Max as 300)?and how to bring the line chart to come down After restricting the x-axis up to 300?
How to get the line chart Value as 500 and how to bring the line chart to come down After restricting the x-axis up to 300?is there any possibilities?
Please find the below screen shot for your reference
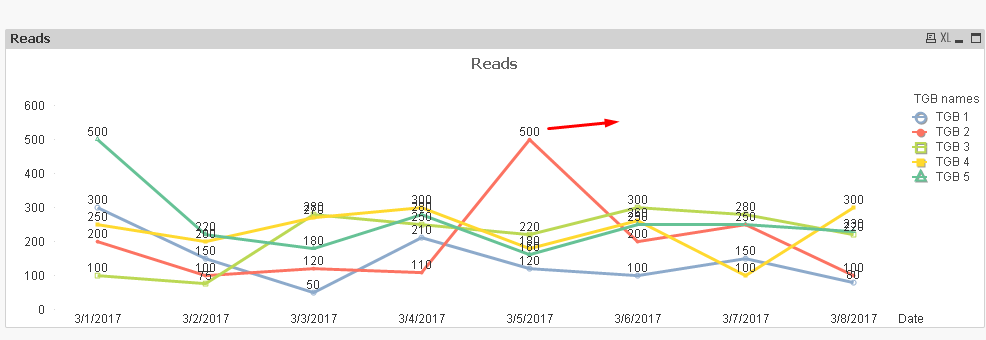
Before Restricting the line chart:
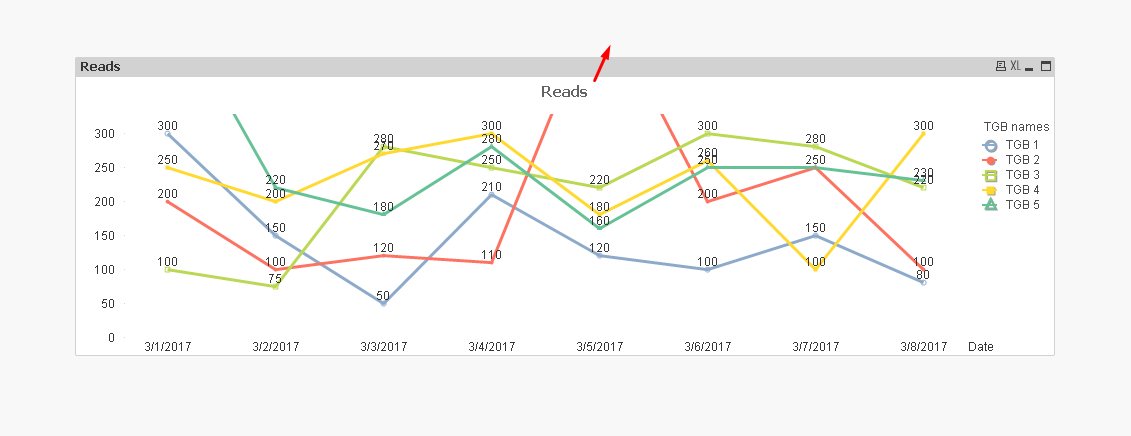
After Restricting the X axis up to 300(static Max as 300):
Thanks
Muthu
Accepted Solutions
- Mark as New
- Bookmark
- Subscribe
- Mute
- Subscribe to RSS Feed
- Permalink
- Report Inappropriate Content
- Mark as New
- Bookmark
- Subscribe
- Mute
- Subscribe to RSS Feed
- Permalink
- Report Inappropriate Content
How do you imagine it should come down? I am not sure what the expectation is, can you elaborate?
- Mark as New
- Bookmark
- Subscribe
- Mute
- Subscribe to RSS Feed
- Permalink
- Report Inappropriate Content
Hi Sunny,
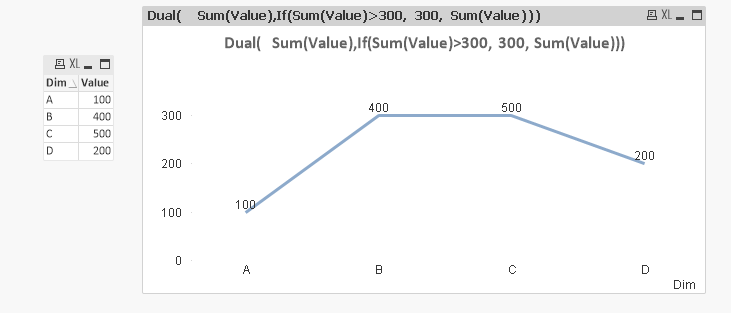
Actually, I need a Trending line chart. in which the Y- Axis should Contain the Max value of 300.
Requirements:
1. if the data goes more than 300 (ie) 500 the line chart should come only up to 300.
2. in data points it, need to show as 500
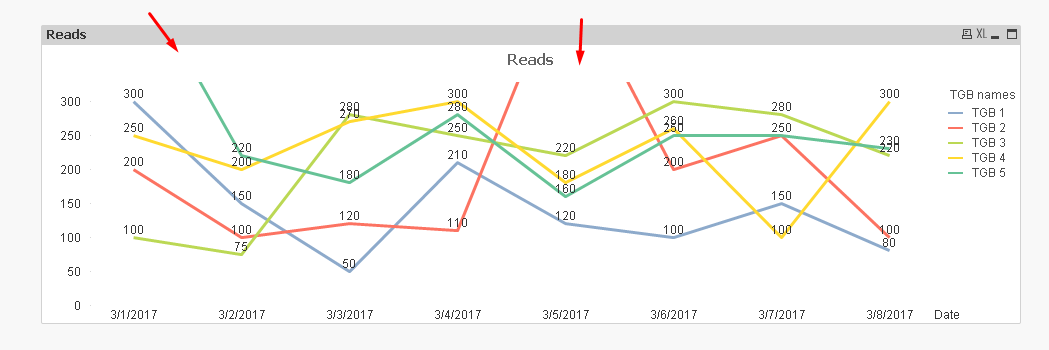
Before:
After:
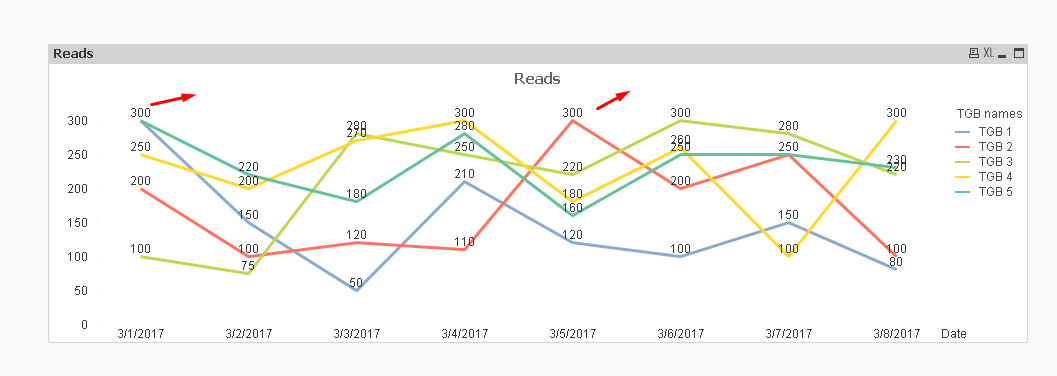
Expression: expression for after chart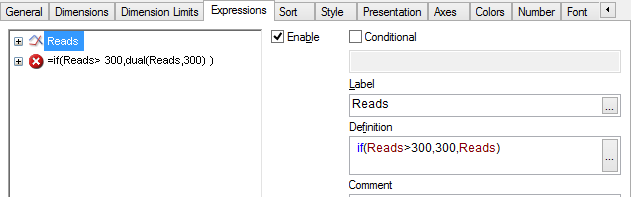
I got the 1st point but I cant able to get the 2 nd point (Ie) actual value in the data points
please help me to get the requirement I want
Thank you
Muthu
- Mark as New
- Bookmark
- Subscribe
- Mute
- Subscribe to RSS Feed
- Permalink
- Report Inappropriate Content
May be like this?
- Mark as New
- Bookmark
- Subscribe
- Mute
- Subscribe to RSS Feed
- Permalink
- Report Inappropriate Content
Thank you so much Tresesco this is Exactly what i need
Thank you so much