Unlock a world of possibilities! Login now and discover the exclusive benefits awaiting you.
- Qlik Community
- :
- All Forums
- :
- QlikView App Dev
- :
- How to have plot/line like this in Excel
Options
- Subscribe to RSS Feed
- Mark Topic as New
- Mark Topic as Read
- Float this Topic for Current User
- Bookmark
- Subscribe
- Mute
- Printer Friendly Page
Turn on suggestions
Auto-suggest helps you quickly narrow down your search results by suggesting possible matches as you type.
Showing results for
Not applicable
2015-07-22
05:11 AM
- Mark as New
- Bookmark
- Subscribe
- Mute
- Subscribe to RSS Feed
- Permalink
- Report Inappropriate Content
How to have plot/line like this in Excel
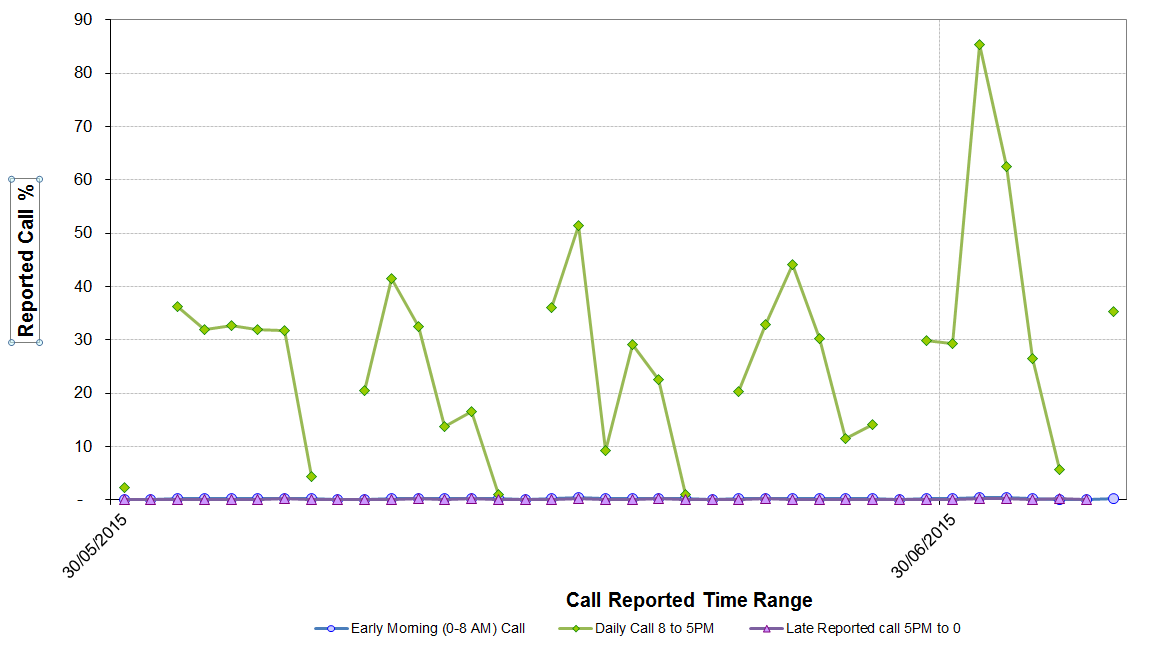
How can Iacheive such plotting.
I have call Data : CallStartDate, Call %.
Thank You
222 Views
2 Replies
Not applicable
2015-07-22
05:36 AM
Author
- Mark as New
- Bookmark
- Subscribe
- Mute
- Subscribe to RSS Feed
- Permalink
- Report Inappropriate Content
Hi,
So call % is your expressions, and CallStartDate is your dimension. But there are three expressions in this case
- Morning call
- daily call
- late reported call
You can create individual expressions and isolate the data using set analysis. Just search set analysis. It should help solve your problems.
129 Views
Not applicable
2015-07-22
08:54 AM
Author
- Mark as New
- Bookmark
- Subscribe
- Mute
- Subscribe to RSS Feed
- Permalink
- Report Inappropriate Content
Any example, I have trie some expression, but still not working
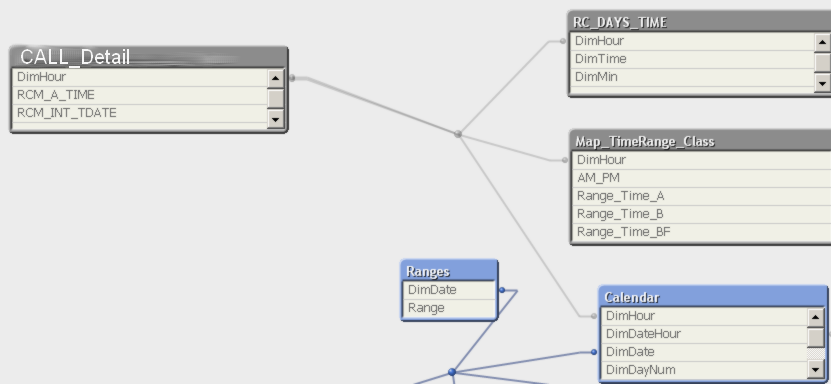
AM_PM correspond to time range :
- Morning call
- daily call
- late reported cal
Percentage is AVG(UTCount)
Thanks
129 Views