Unlock a world of possibilities! Login now and discover the exclusive benefits awaiting you.
- Qlik Community
- :
- All Forums
- :
- QlikView App Dev
- :
- How to show last 3 months sales for maximum date o...
- Subscribe to RSS Feed
- Mark Topic as New
- Mark Topic as Read
- Float this Topic for Current User
- Bookmark
- Subscribe
- Mute
- Printer Friendly Page
- Mark as New
- Bookmark
- Subscribe
- Mute
- Subscribe to RSS Feed
- Permalink
- Report Inappropriate Content
How to show last 3 months sales for maximum date of the month
Dear Qlik,
Please suggest on this.
Here i have months and trend analysis in Bar chart
Dimension-> Month,
Expression - >
round(count({<Date={"$(=max(Date))"},[Difference Category]={'7Days'}>} DISTINCT Items)/
Count(DISTINCT{<Date={"$(=max(Date))"}>} Items *100,0.01,0).
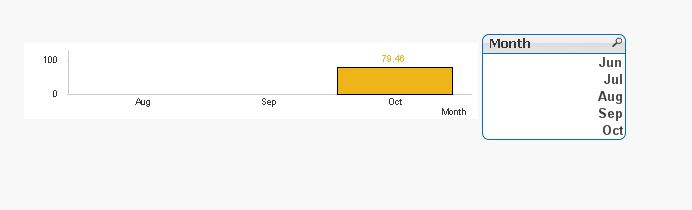
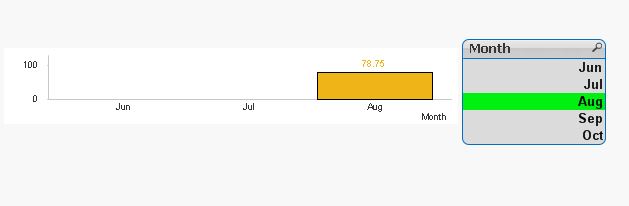
I can able to see only recent month bar.
Please find the below screen shot for your reference.
i should see the sep and aug months with calculation of the maximum date of that particular month. Please advice how to overcome this,
Thanks in Advance.
Accepted Solutions
- Mark as New
- Bookmark
- Subscribe
- Mute
- Subscribe to RSS Feed
- Permalink
- Report Inappropriate Content
Now I see the point. So, there are many ways how to get max day of the month, but I prefer to add one more column as flag of max day.
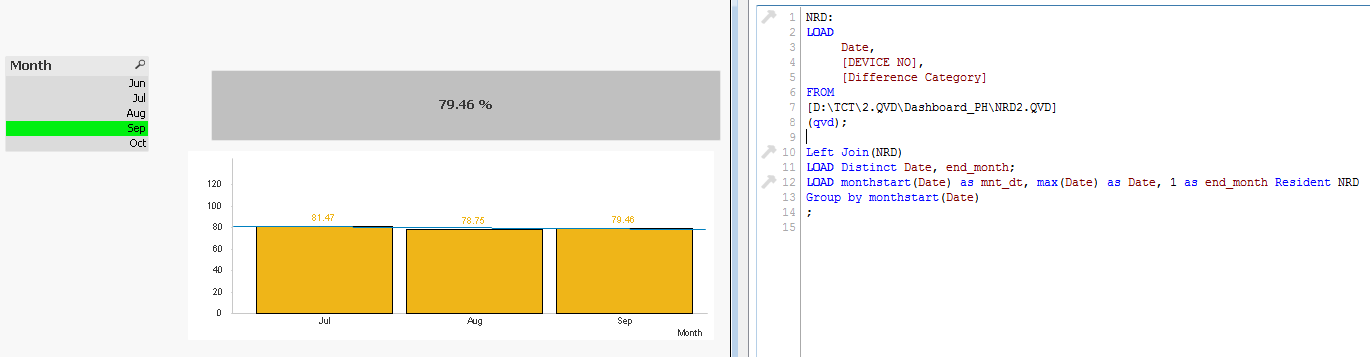
And then use a simple set analysis condition: end_month = {1}
hope this way will be suitable for you
- Mark as New
- Bookmark
- Subscribe
- Mute
- Subscribe to RSS Feed
- Permalink
- Report Inappropriate Content
Hello!
Improve your set condition with Addmonths function:
Date={">$(=monthstart(Addmonths(max(Date),-2)))"} if your month field ends with the last day of month.
- Mark as New
- Bookmark
- Subscribe
- Mute
- Subscribe to RSS Feed
- Permalink
- Report Inappropriate Content
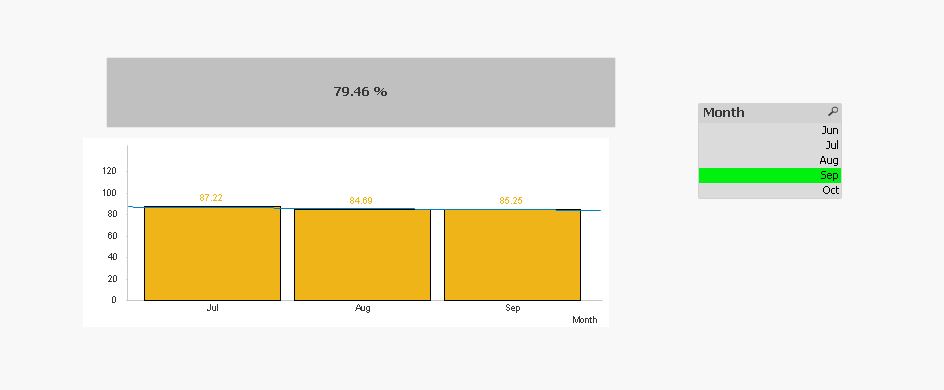
Thanks Sergey,
Thanks for your response.
I tried with this one but values are not correct. It taking entire month data not max date of the month.
Please find the below screen shot and attached QVW as well.
Thanks in advance.
- Mark as New
- Bookmark
- Subscribe
- Mute
- Subscribe to RSS Feed
- Permalink
- Report Inappropriate Content
Now I see the point. So, there are many ways how to get max day of the month, but I prefer to add one more column as flag of max day.
And then use a simple set analysis condition: end_month = {1}
hope this way will be suitable for you
- Mark as New
- Bookmark
- Subscribe
- Mute
- Subscribe to RSS Feed
- Permalink
- Report Inappropriate Content
Thanks for your great help.
It's working good. Thanks once again.