Unlock a world of possibilities! Login now and discover the exclusive benefits awaiting you.
- Qlik Community
- :
- All Forums
- :
- QlikView App Dev
- :
- Re: I Want To Create the Bar Graph for Last Two Ye...
- Subscribe to RSS Feed
- Mark Topic as New
- Mark Topic as Read
- Float this Topic for Current User
- Bookmark
- Subscribe
- Mute
- Printer Friendly Page
- Mark as New
- Bookmark
- Subscribe
- Mute
- Subscribe to RSS Feed
- Permalink
- Report Inappropriate Content
I Want To Create the Bar Graph for Last Two Years Sales by category
Please find the below sample Data,
Order Id | Orderdate | Year | Category | SalesValue |
1 | 8/10/2014 | 2014 | Laptop | 2000 |
1 | 8/10/2014 | 2014 | Mobile Phone | 5000 |
1 | 8/10/2014 | 2014 | Monitor | 500 |
1 | 8/10/2014 | 2014 | TV | 3000 |
2 | 8/11/2015 | 2015 | Laptop | 4000 |
2 | 8/11/2015 | 2015 | Mobile Phone | 10000 |
2 | 8/11/2015 | 2015 | Monitor | 1000 |
2 | 8/11/2015 | 2015 | TV | 6000 |
3 | 8/12/2016 | 2016 | Laptop | 2001 |
3 | 8/12/2016 | 2016 | Mobile Phone | 5001 |
3 | 8/12/2016 | 2016 | Monitor | 501 |
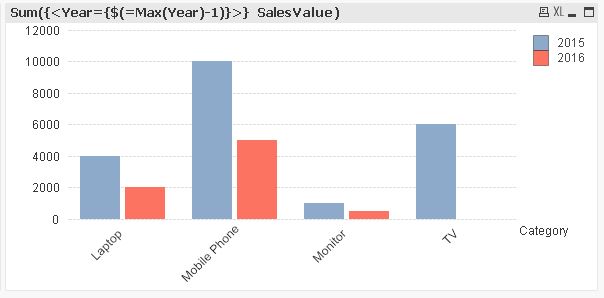
I want to Show the last two years sales is bar Graph for 2016 & 2015 based on category
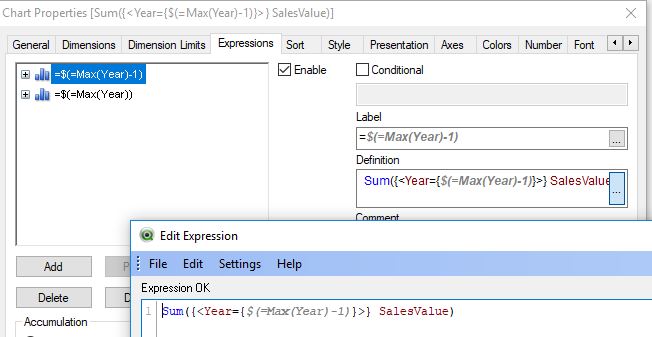
I have used the Set Expression as :Sum({<Year={$(=Max(Year))}>}SalesValue) and Sum({<Year={$(=Max(Year)-1)}>}SalesValue)
but this expression is not working
Kindly help me out
Thanks in Advance!!
Accepted Solutions
- Mark as New
- Bookmark
- Subscribe
- Mute
- Subscribe to RSS Feed
- Permalink
- Report Inappropriate Content
Hi,
your expressions should work, here one example:
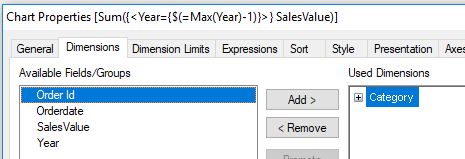
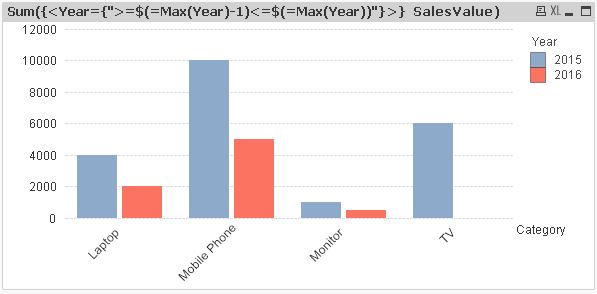
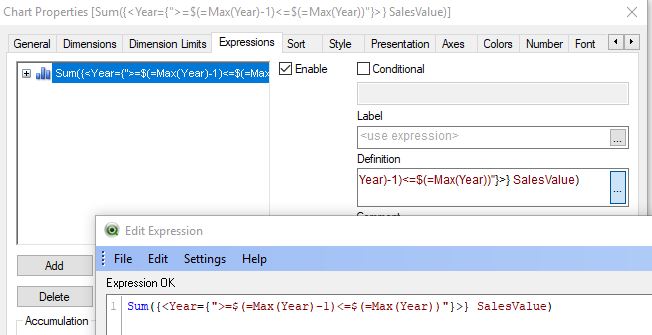
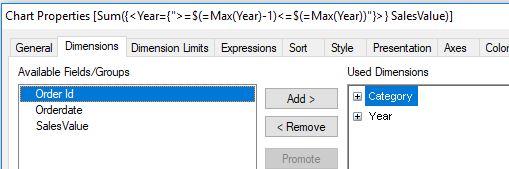
Another solution might be to add a Year dimension and use only one expression like this:
hope this helps
regards
Marco
- Mark as New
- Bookmark
- Subscribe
- Mute
- Subscribe to RSS Feed
- Permalink
- Report Inappropriate Content
Hi,
your expressions should work, here one example:
Another solution might be to add a Year dimension and use only one expression like this:
hope this helps
regards
Marco