Unlock a world of possibilities! Login now and discover the exclusive benefits awaiting you.
- Qlik Community
- :
- All Forums
- :
- QlikView App Dev
- :
- Re: Is there a way to "cascade" a pie style chart?
- Subscribe to RSS Feed
- Mark Topic as New
- Mark Topic as Read
- Float this Topic for Current User
- Bookmark
- Subscribe
- Mute
- Printer Friendly Page
- Mark as New
- Bookmark
- Subscribe
- Mute
- Subscribe to RSS Feed
- Permalink
- Report Inappropriate Content
Is there a way to "cascade" a pie style chart?
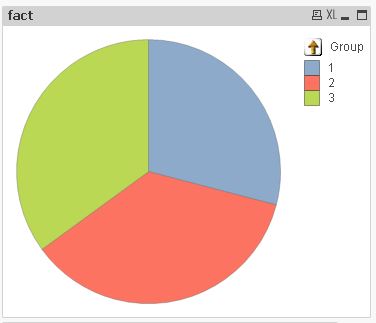
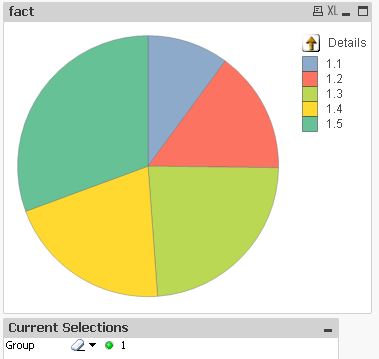
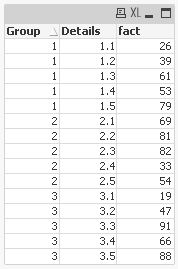
In the claim data I have the Primary Diagnosis and the associated Diagnosis Grouper. Displaying the primary in a pie chart lends to many slivers. Using the grouper works better visually. The goal would be to display the data with the groupers only first. Upon selecting a grouper section, then show the pie with the associated primaries. Trying to remove the intimidating visual of nesting pie charts (Grouper.pdf).
- Mark as New
- Bookmark
- Subscribe
- Mute
- Subscribe to RSS Feed
- Permalink
- Report Inappropriate Content
Try with a drill down dimension in your pie chart.
- Mark as New
- Bookmark
- Subscribe
- Mute
- Subscribe to RSS Feed
- Permalink
- Report Inappropriate Content
maybe like this:
hope this helps
regards
Marco
- Mark as New
- Bookmark
- Subscribe
- Mute
- Subscribe to RSS Feed
- Permalink
- Report Inappropriate Content
from your comment of Dimension Drill down, I found the section on drill down groups to apply to the graph. simple click on Edit Groups to create, replace the dimensions, Perfect!! Also, thanks for the sample.
- Mark as New
- Bookmark
- Subscribe
- Mute
- Subscribe to RSS Feed
- Permalink
- Report Inappropriate Content
You're welcome.
Please close your thread if your question is answered.
Thanks
Regards
Marco