Unlock a world of possibilities! Login now and discover the exclusive benefits awaiting you.
- Qlik Community
- :
- All Forums
- :
- QlikView App Dev
- :
- Is there a way to show data values even on small s...
- Subscribe to RSS Feed
- Mark Topic as New
- Mark Topic as Read
- Float this Topic for Current User
- Bookmark
- Subscribe
- Mute
- Printer Friendly Page
- Mark as New
- Bookmark
- Subscribe
- Mute
- Subscribe to RSS Feed
- Permalink
- Report Inappropriate Content
Is there a way to show data values even on small slices in a stacked bar graph? Qlik hides them when the slice is too small.
I have a chart showing percentage makeup of a market by month and shows the breakdown by product in a stacked bar graph as shown below. The different colours are the different products.
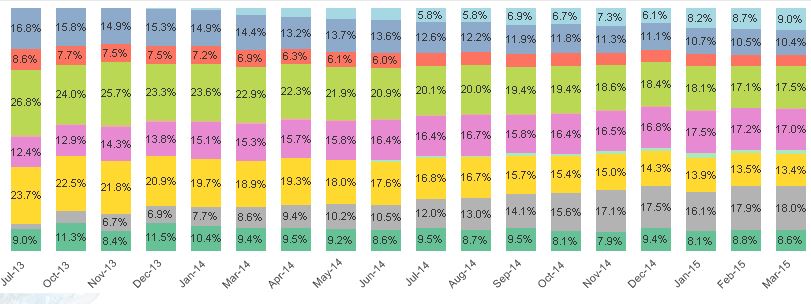
My problem is that the percentage data value which is shown disappears when the slice gets too small.
I need it to show up, how do I do that?
- Mark as New
- Bookmark
- Subscribe
- Mute
- Subscribe to RSS Feed
- Permalink
- Report Inappropriate Content
If the slice or segment is too small it may overshadow another slice data point number if you forced it to show somehow?
If the user can see the number if they hover over the slice it will show a pop-up to reveal it. But is it significant enough to even worry about?
- Mark as New
- Bookmark
- Subscribe
- Mute
- Subscribe to RSS Feed
- Permalink
- Report Inappropriate Content
Normally I would say no, but in this case yes because two of the products listed are ours, and one of them recently launched and is one of the thin slices. So they frequently need to see all the values (particularly that light blue slice).
Otherwise I would agree.
- Mark as New
- Bookmark
- Subscribe
- Mute
- Subscribe to RSS Feed
- Permalink
- Report Inappropriate Content
Ok, I emphasize with your dilemma. Perhaps placing a Bar chart underneath but make it transparent to only show the numbers? But it will still behave same way. Hope some others will have a clever idea I'm stumped.
- Mark as New
- Bookmark
- Subscribe
- Mute
- Subscribe to RSS Feed
- Permalink
- Report Inappropriate Content
If hover over display is not sufficient, you may give an option to select the product(s) having small slice(s) so that they are magnified.
Excel export of the data will also show all numbers.
- Mark as New
- Bookmark
- Subscribe
- Mute
- Subscribe to RSS Feed
- Permalink
- Report Inappropriate Content
Hmm, I think this will have to do if there's no way to figure out what I wanted.
I also just think the graph looks sloppy this way, especially with some products having their labels stop half way through, don't understand why they didn't include an option not to autohide the values.