Unlock a world of possibilities! Login now and discover the exclusive benefits awaiting you.
- Qlik Community
- :
- All Forums
- :
- QlikView App Dev
- :
- Re: Is there any way to check memory consumption s...
- Subscribe to RSS Feed
- Mark Topic as New
- Mark Topic as Read
- Float this Topic for Current User
- Bookmark
- Subscribe
- Mute
- Printer Friendly Page
- Mark as New
- Bookmark
- Subscribe
- Mute
- Subscribe to RSS Feed
- Permalink
- Report Inappropriate Content
Is there any way to check memory consumption status for sheet/reports?
Hi,
We have a qlikview node with 386 gb of ram. Sometimes, the ram usage jumps from 60% to 100%. I want to trace exactly which document and which chart cause the whole system to crash.
I tried to look at document analyzer but could not find anything that could help me which object has caused the memory crash at that specific time
Can someone please tell me if there is a way to check the memory usage documentwise or even better if I could have more detail than that for memory consumption?
Shah
- Mark as New
- Bookmark
- Subscribe
- Mute
- Subscribe to RSS Feed
- Permalink
- Report Inappropriate Content
See this blog post: Recipe for a Memory Statistics analysis
talk is cheap, supply exceeds demand
- Mark as New
- Bookmark
- Subscribe
- Mute
- Subscribe to RSS Feed
- Permalink
- Report Inappropriate Content
Hi Syed,
Governance Dashboard can help u.
Data Governance & Data Management with QlikView & QlikView Expressor
Thanks,
AS
- Mark as New
- Bookmark
- Subscribe
- Mute
- Subscribe to RSS Feed
- Permalink
- Report Inappropriate Content
Hi,
Sometimes shared file corruption causes this.
If you can remove out a shared file you suspect, you may solve this.
This is one of the likely reasons.
Thanks,
Rajesh Vaswani
- Mark as New
- Bookmark
- Subscribe
- Mute
- Subscribe to RSS Feed
- Permalink
- Report Inappropriate Content
Hi Syed,
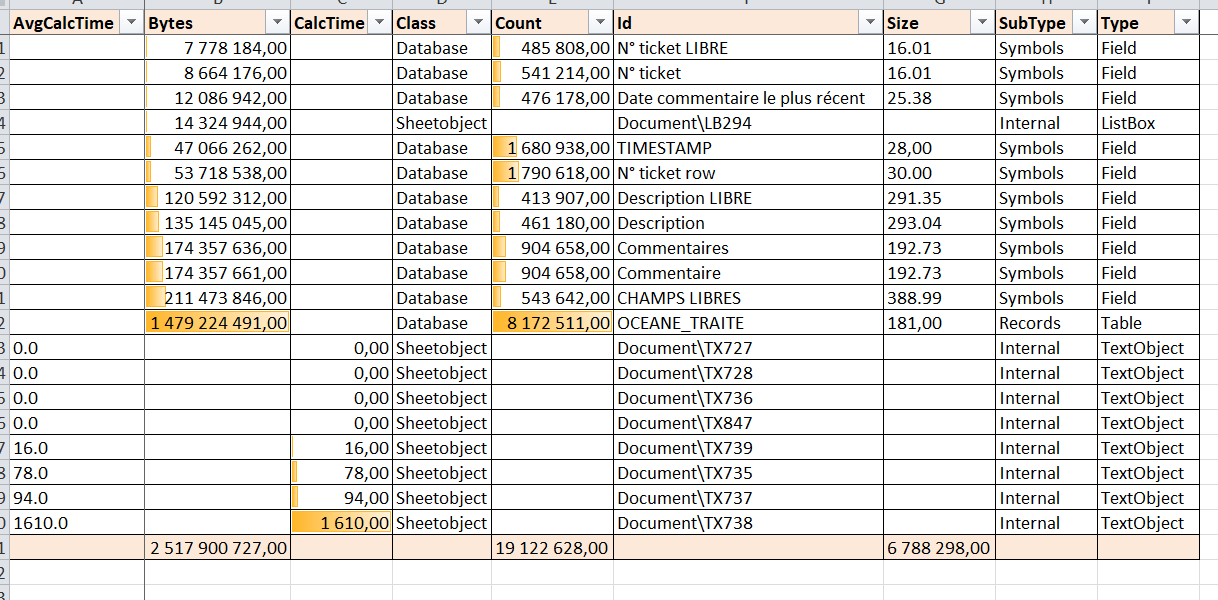
Open your Dashboard - > Sheet Properties -> Objects -> Check for Calc Time and Memory columns.
Calc Time - Refers to the loading time of the chart and
Memory - Refers to the memory size
This way you can identify which object is taking more time and which object is taking more memory.
Regards,
Jagan.
- Mark as New
- Bookmark
- Subscribe
- Mute
- Subscribe to RSS Feed
- Permalink
- Report Inappropriate Content
Hi jagan,
i'm preparing a report to analyze the performance and the weaknesses of a dashboard(qvw) , and i'm using the report generated by Qlik view as you mentioned in your comment using : Open your Dashboard - > Sheet Properties -> Objects -> Check for Calc Time and Memory columns.
My questions are:
what is the time measure and meaning of Calc Time and AvgCalcTime ?
How can we know the loading time lapse of a table ?
Thank you