Unlock a world of possibilities! Login now and discover the exclusive benefits awaiting you.
- Qlik Community
- :
- All Forums
- :
- QlikView App Dev
- :
- Last 2 Month Count
- Subscribe to RSS Feed
- Mark Topic as New
- Mark Topic as Read
- Float this Topic for Current User
- Bookmark
- Subscribe
- Mute
- Printer Friendly Page
- Mark as New
- Bookmark
- Subscribe
- Mute
- Subscribe to RSS Feed
- Permalink
- Report Inappropriate Content
Last 2 Month Count
Hi,
I have created an expression in which if we select a month it counts the unique outlet from Current and last month.
But if we add the month in the table it starts showing the unique outlet for individual month.
e.g
State #Count
AP 85
State Month #Count
AP 1 67
AP 2 100
I want the output to be showing unique outlet for the current month and last month for each month not individual unique outlet for each month.
Thus if for 3 and 2 we have 100 outlet
2 and 1 month we have 85 unique outlet then output should be like
State Month #Count
AP 2 85
AP 3 100
- Tags:
- set analysis
- « Previous Replies
-
- 1
- 2
- Next Replies »
- Mark as New
- Bookmark
- Subscribe
- Mute
- Subscribe to RSS Feed
- Permalink
- Report Inappropriate Content
Would you be able to share a sample where you are facing this issue for us to play around with?
- Mark as New
- Bookmark
- Subscribe
- Mute
- Subscribe to RSS Feed
- Permalink
- Report Inappropriate Content
Hi Sunny,
I am attaching the Qlikview file for the reference.
In the chart I made I wanted unique outlet count for current and last month not just for individual month as it is coming currently.
Thus in month 2 I should 6 not 3.
Regards,
- Mark as New
- Bookmark
- Subscribe
- Mute
- Subscribe to RSS Feed
- Permalink
- Report Inappropriate Content
Shouldn't it be 8 instead (for month 2)? Try exp like:
=RangeSum(Above(Count({<Month={">=$(=$(vMaxMonthOneLess))<=$(=$(vMaxMonth))"}>} distinct OutletCode) ,0,2))
- Mark as New
- Bookmark
- Subscribe
- Mute
- Subscribe to RSS Feed
- Permalink
- Report Inappropriate Content
Hi,
We have 5 unique in Month 1 and one unique 7 from month from 2 thus 6 unique combining 1 and 2 month
- Mark as New
- Bookmark
- Subscribe
- Mute
- Subscribe to RSS Feed
- Permalink
- Report Inappropriate Content
Ahh, the old problem. There has been a lengthy discussion on this community over this issue. With sortable aggr(), this could probably be handled I guess (never tried; just a guess). Is a script solution an option for you?
- Mark as New
- Bookmark
- Subscribe
- Mute
- Subscribe to RSS Feed
- Permalink
- Report Inappropriate Content
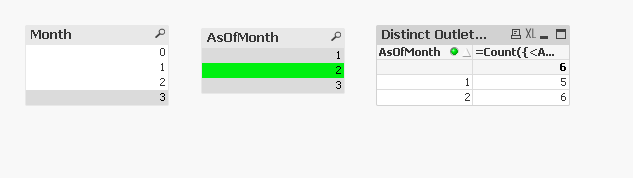
Implementing an AsOfTable might help here
Outlet:
LOAD * INLINE [
OutletCode, Month
1, 1
2, 1
3, 1
4, 1
5, 1
1, 2
3, 2
7, 2
12, 3
1, 3
3, 3
7, 3
];
OutletToState:
LOAD * INLINE [
OutletCode, State
1, AP
2, KAR
3, TN
4, HR
5, GUJ
6, J&K
7, MAHA
12, JHAR
];
AsOfTable:
LOAD Month as AsOfMonth,
Month - IterNo() + 1 as Month
Resident Outlet
While Month - IterNo() + 1 >= 0;
- Mark as New
- Bookmark
- Subscribe
- Mute
- Subscribe to RSS Feed
- Permalink
- Report Inappropriate Content
Hi Sunny,
Thanks for the reply.
The file I have shared is very low version of the code I have in actual file.
By any chance will it be possible to do it directly in chart expression.
Regards,
Rahul
- Mark as New
- Bookmark
- Subscribe
- Mute
- Subscribe to RSS Feed
- Permalink
- Report Inappropriate Content
Sure thing, but remember this will make things extremely complicated...
=RangeSum(ABove(
Sum({<Month={">=$(=$(vMaxMonthOneLess))<=$(=$(vMaxMonth))"}>}Aggr(If(Only({<Month={">=$(=$(vMaxMonthOneLess))<=$(=$(vMaxMonth))"}>}OutletCode) = Above(Only({<Month={">=$(=$(vMaxMonthOneLess))<=$(=$(vMaxMonth))"}>}OutletCode)), Null(),
Count({<Month={">=$(=$(vMaxMonthOneLess))<=$(=$(vMaxMonth))"}>} OutletCode)), OutletCode, (Month, (NUMERIC)))), 0, RowNo()))
Also, this will only work if you have QV12 or above... or else you will need to sort Month field in the script in the ascending order.... if it is already sorted like that... then you can try this
=RangeSum(ABove(
Sum({<Month={">=$(=$(vMaxMonthOneLess))<=$(=$(vMaxMonth))"}>}Aggr(If(Only({<Month={">=$(=$(vMaxMonthOneLess))<=$(=$(vMaxMonth))"}>}OutletCode) = Above(Only({<Month={">=$(=$(vMaxMonthOneLess))<=$(=$(vMaxMonth))"}>}OutletCode)), Null(),
Count({<Month={">=$(=$(vMaxMonthOneLess))<=$(=$(vMaxMonth))"}>} OutletCode)), OutletCode, Month)), 0, RowNo()))
- Mark as New
- Bookmark
- Subscribe
- Mute
- Subscribe to RSS Feed
- Permalink
- Report Inappropriate Content
Hi Sunny,
Thanks for the reply.
But the formula seems to work when I do the selection of the particular month.
Like if I select 2 it shows 6 but if I don't select any month or select 3 then the number of outlet for 2 becomes 3 again.
Regards,
- « Previous Replies
-
- 1
- 2
- Next Replies »