Unlock a world of possibilities! Login now and discover the exclusive benefits awaiting you.
- Qlik Community
- :
- All Forums
- :
- QlikView App Dev
- :
- Re: Last 4 Quarter sales
- Subscribe to RSS Feed
- Mark Topic as New
- Mark Topic as Read
- Float this Topic for Current User
- Bookmark
- Subscribe
- Mute
- Printer Friendly Page
- Mark as New
- Bookmark
- Subscribe
- Mute
- Subscribe to RSS Feed
- Permalink
- Report Inappropriate Content
Last 4 Quarter sales
Hi ,
Please guide me how i can sum(sales) for only for last 4 quarter from today.
Please find attached example on same.
Thanks in advance.
- « Previous Replies
-
- 1
- 2
- Next Replies »
- Mark as New
- Bookmark
- Subscribe
- Mute
- Subscribe to RSS Feed
- Permalink
- Report Inappropriate Content
Hi Srinivasa,
First We need to Split the sales into Quaters Based on Shipdate as i Show below
if(month(ShipDate)='Jan','Q1',
if(month(ShipDate)='Feb','Q1',
if(month(ShipDate)='Mar','Q1',
if(month(ShipDate)='Apr','Q2',
if(month(ShipDate)='May','Q2',
if(month(ShipDate)='Jun','Q2',
if(month(ShipDate)='Jul','Q3',
if(month(ShipDate)='Aug','Q3',
if(month(ShipDate)='Sep','Q3',
if(month(ShipDate)='Oct','Q4',
if(month(ShipDate)='Nov','Q4',
if(month(ShipDate)='Dec','Q4')
))))))))))) as Quarter,
Add this as a column in your Table
Then we need to calculate the Sales for Q4 Alone using set analysis as i shown below
=sum({<[Quarter]={'Q2'}>}Sales)
Hope this helps
Regards,
Eromiya Simon
- Mark as New
- Bookmark
- Subscribe
- Mute
- Subscribe to RSS Feed
- Permalink
- Report Inappropriate Content
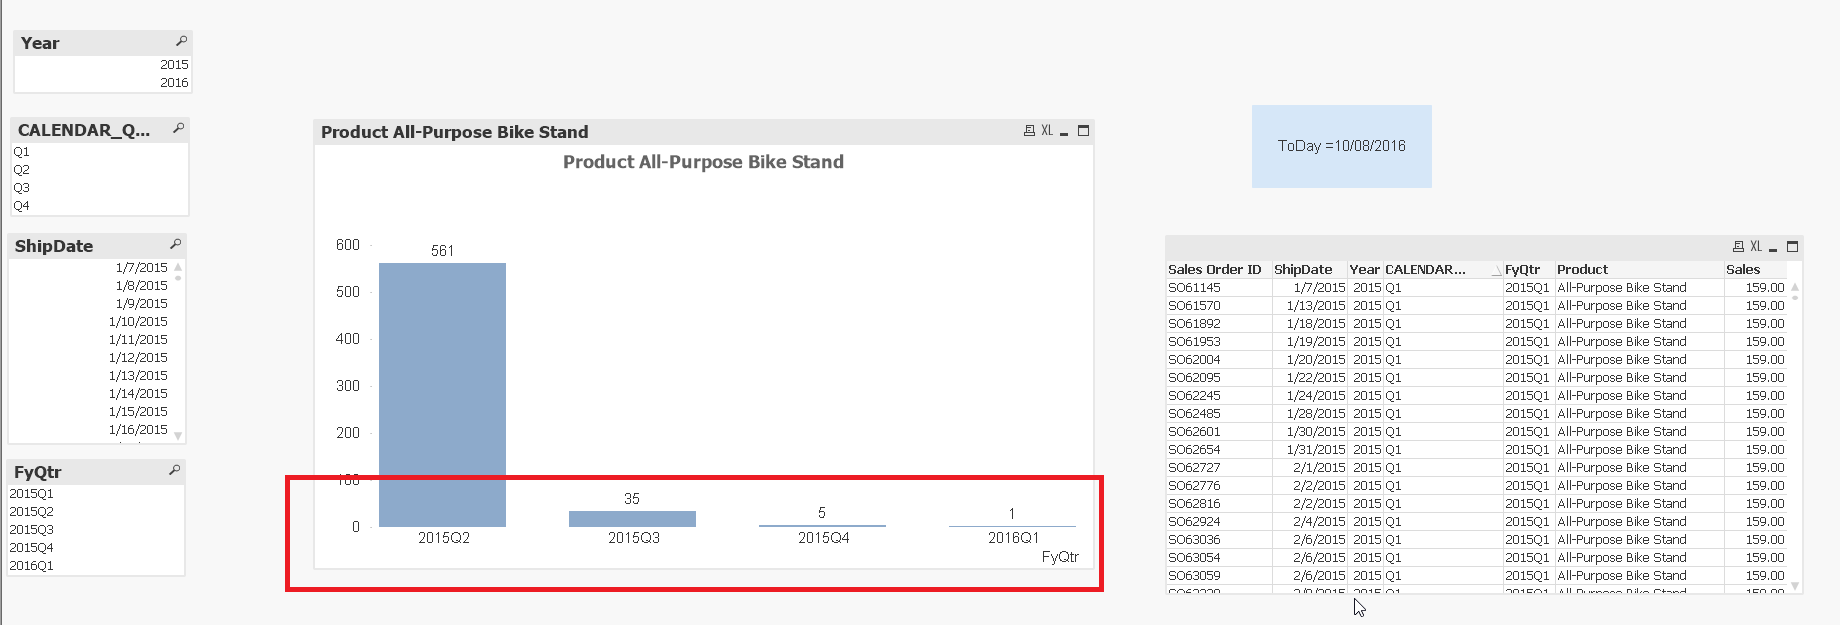
May be try this:
=Count(DISTINCT {<ShipDate = {"$(='>=' & Date(QuarterStart(Max(ShipDate), -3)) & '<=' & Date(Max(ShipDate)))"}, FyQtr, CALENDAR_QUARTER, Year>} Sales)
- Mark as New
- Bookmark
- Subscribe
- Mute
- Subscribe to RSS Feed
- Permalink
- Report Inappropriate Content
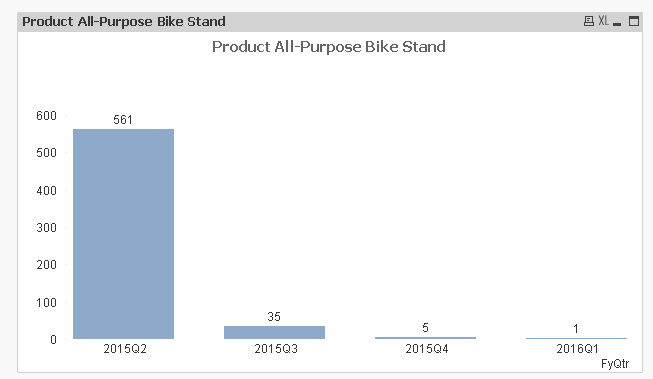
Is this?
- Mark as New
- Bookmark
- Subscribe
- Mute
- Subscribe to RSS Feed
- Permalink
- Report Inappropriate Content
Thanks Sunny for your help,
count looks good till 2015Q3 but 2015Q2 values comes less in my real project due to ship date close quarter and opened quarter so is there anything we can take count from this chart and use in another variables?
Thanks
Srini
- Mark as New
- Bookmark
- Subscribe
- Mute
- Subscribe to RSS Feed
- Permalink
- Report Inappropriate Content
Due to what?
due to ship date close quarter and opened quarter
Not exactly sure what you mean? Can you may be explain with an example?
- Mark as New
- Bookmark
- Subscribe
- Mute
- Subscribe to RSS Feed
- Permalink
- Report Inappropriate Content
Hi Sunny,
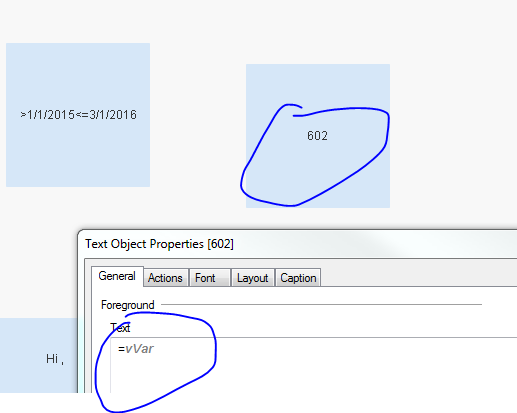
If we copy same calculation in chart and text box
=Count(DISTINCT {<ShipDate = {"$(='>=' & Date(QuarterStart(Max(ShipDate), -3)) & '<=' & Date(Max(ShipDate)))"}, FyQtr, CALENDAR_QUARTER, Year>} Sales)
count is mismatching for last 4 qtr any idea?
In chart its count shows as (602) and in text box its shows as (562)
Thanks for any thoughts .
- Mark as New
- Bookmark
- Subscribe
- Mute
- Subscribe to RSS Feed
- Permalink
- Report Inappropriate Content
That is because we are doing a DISTINCT Count. To get 602 in a text box, you can try this:
=Sum(Aggr(Count(DISTINCT {<ShipDate = {"$(='>=' & Date(QuarterStart(Max(ShipDate), -3)) & '<=' & Date(Max(ShipDate)))"}, FyQtr, CALENDAR_QUARTER, Year>} Sales), FyQtr))
- Mark as New
- Bookmark
- Subscribe
- Mute
- Subscribe to RSS Feed
- Permalink
- Report Inappropriate Content
Thanks Sunny,
Is there anything I can select sum for last 4 qtr in variables based on selection from chart in my attached example (count(distinct Sales)).
Thanks
- Mark as New
- Bookmark
- Subscribe
- Mute
- Subscribe to RSS Feed
- Permalink
- Report Inappropriate Content
May be save the above expression in a variable?
- « Previous Replies
-
- 1
- 2
- Next Replies »