Unlock a world of possibilities! Login now and discover the exclusive benefits awaiting you.
- Qlik Community
- :
- All Forums
- :
- QlikView App Dev
- :
- Legend not always showing on stacked bar chart unt...
- Subscribe to RSS Feed
- Mark Topic as New
- Mark Topic as Read
- Float this Topic for Current User
- Bookmark
- Subscribe
- Mute
- Printer Friendly Page
- Mark as New
- Bookmark
- Subscribe
- Mute
- Subscribe to RSS Feed
- Permalink
- Report Inappropriate Content
Legend not always showing on stacked bar chart until I click it
Hi Community,
Can someone help me understand why my legend doesn't always show on my stacked bar charts until I click it.
When I create the chart it looks like this:
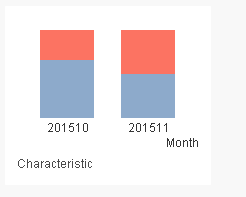
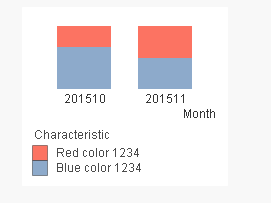
The legend is missing. But then when I click somewhere on the chart, it shows up.
When I click around outside the chart, it goes away again. Is this because the legend is too long? I tried shortening it and didn't run into the issue. Example attached.
- « Previous Replies
-
- 1
- 2
- Next Replies »
Accepted Solutions
- Mark as New
- Bookmark
- Subscribe
- Mute
- Subscribe to RSS Feed
- Permalink
- Report Inappropriate Content
Jesse Unger wrote:
Thanks Stefan,
Is there a way to know how big is big enough? The bigger I make that, the smaller is the chart area. I see that if I keep adding characteristics, the legend turns into a scrollable box in any case...
Jesse,
since you asked for a way to know how big is big enough: I don't know it. It's always a little bit of fiddling around when changing these legend settings and positions.
This effect you've seen when clicking around seems to be more a bug than a feature to me. If you can't increase your chart size, I think using a legend in a chart this small is not really user friendly.
Maybe consider removing the legend completely from the chart and display all dimension values and their color in another object, like one legend for the complete sheet.
I remember a blog post here in the forum on how to do that, but just can't find it right now.
Regards,
Stefan
- Mark as New
- Bookmark
- Subscribe
- Mute
- Subscribe to RSS Feed
- Permalink
- Report Inappropriate Content
Jesse,
you can enlarge the legend area a tiny little bit, this should allow Qlik to draw the legend all the time.
You can do so by using CTRL-SHIFT and the mouse when the chart is active.
Hope this helps,
Stefan
- Mark as New
- Bookmark
- Subscribe
- Mute
- Subscribe to RSS Feed
- Permalink
- Report Inappropriate Content
Thanks Stefan,
Is there a way to know how big is big enough? The bigger I make that, the smaller is the chart area. I see that if I keep adding characteristics, the legend turns into a scrollable box in any case...
- Mark as New
- Bookmark
- Subscribe
- Mute
- Subscribe to RSS Feed
- Permalink
- Report Inappropriate Content
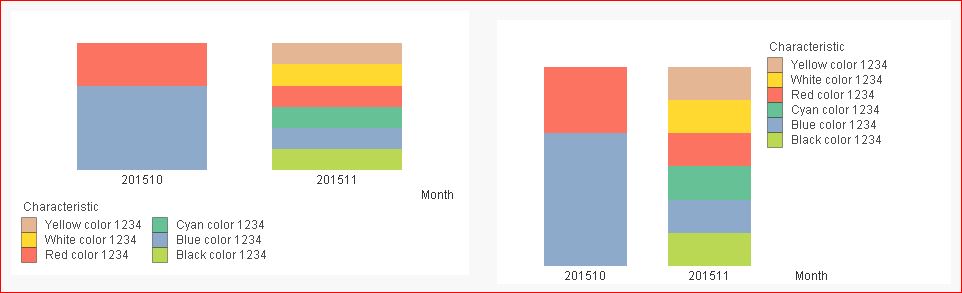
May be you can adjust your legends box (not a bar - so the bar will not affect) based on you characteristics values.
Just, i tried with 6 characteristics value..
- Mark as New
- Bookmark
- Subscribe
- Mute
- Subscribe to RSS Feed
- Permalink
- Report Inappropriate Content
use Ctrl+Shift to adjust your bars and legends....
- Mark as New
- Bookmark
- Subscribe
- Mute
- Subscribe to RSS Feed
- Permalink
- Report Inappropriate Content
Another possibility is that another sheet object is overlaying the bottom of the chart (but on the same layer). When you click on the chart, you are bringing the chart to the top, making the legend visible.
When the legend is not visible, right click on that area of the sheet and select Properties... This will allow you to inspect the object at the top at that location. If it is not the chart, then that is your problem. Resize the object so that it does not overlay the chart, or put it on a lower layer (Properties | Layout).
- Mark as New
- Bookmark
- Subscribe
- Mute
- Subscribe to RSS Feed
- Permalink
- Report Inappropriate Content
So in this case I'd have to have a legend on the right?
- Mark as New
- Bookmark
- Subscribe
- Mute
- Subscribe to RSS Feed
- Permalink
- Report Inappropriate Content
Yeah that's how I got the legend on the bottom. The problem is sometime it appears and sometimes it does not.
- Mark as New
- Bookmark
- Subscribe
- Mute
- Subscribe to RSS Feed
- Permalink
- Report Inappropriate Content
I posted an app example with only a minimum of elements, so I know this is not the problem. It's inherent in the object itself
- Mark as New
- Bookmark
- Subscribe
- Mute
- Subscribe to RSS Feed
- Permalink
- Report Inappropriate Content
in chart properties
general tab
there is down:reset user sizing
reset user docking
clik once and chk the chart once.
May helps u
- « Previous Replies
-
- 1
- 2
- Next Replies »