Unlock a world of possibilities! Login now and discover the exclusive benefits awaiting you.
- Qlik Community
- :
- All Forums
- :
- QlikView App Dev
- :
- Line Chart Background Color Extends Beyond Point
Options
- Subscribe to RSS Feed
- Mark Topic as New
- Mark Topic as Read
- Float this Topic for Current User
- Bookmark
- Subscribe
- Mute
- Printer Friendly Page
Turn on suggestions
Auto-suggest helps you quickly narrow down your search results by suggesting possible matches as you type.
Showing results for
Creator
2017-07-04
07:32 PM
- Mark as New
- Bookmark
- Subscribe
- Mute
- Subscribe to RSS Feed
- Permalink
- Report Inappropriate Content
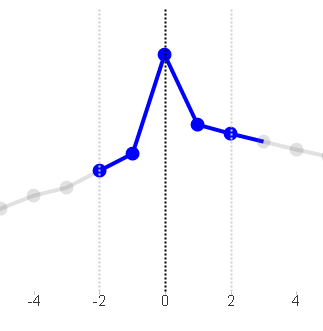
Line Chart Background Color Extends Beyond Point
Is there anyway to get this chart below to not have the line from 2 to 3 be shaded blue? My Background formula has the color set to be blue between -2 and 2 (fABS(xAxis) <=2). Is there an option somewhere I can set so the line after the point doesn't get shaded?
412 Views
2 Replies
2017-07-05
12:07 AM
- Mark as New
- Bookmark
- Subscribe
- Mute
- Subscribe to RSS Feed
- Permalink
- Report Inappropriate Content
That may possible, But when you use Fabs in your expression that won't make sense to me. Because, Fabs() helps us to change the symbol like -ve to +ve. What was the expression you used?
Is should be some thing like for BG of your expression
If(xAxis >= '-2' and xAxis <= 2, Blue(), LightCyan())
Best Anil, When applicable please mark the correct/appropriate replies as "solution" (you can mark up to 3 "solutions". Please LIKE threads if the provided solution is helpful
350 Views
Creator
2017-07-09
10:59 AM
Author
- Mark as New
- Bookmark
- Subscribe
- Mute
- Subscribe to RSS Feed
- Permalink
- Report Inappropriate Content
Logically fabs()<=2 is the same as >= -2 and <= 2
350 Views