Unlock a world of possibilities! Login now and discover the exclusive benefits awaiting you.
- Qlik Community
- :
- All Forums
- :
- QlikView App Dev
- :
- Line Chart set analysis qualifier bug?
- Subscribe to RSS Feed
- Mark Topic as New
- Mark Topic as Read
- Float this Topic for Current User
- Bookmark
- Subscribe
- Mute
- Printer Friendly Page
- Mark as New
- Bookmark
- Subscribe
- Mute
- Subscribe to RSS Feed
- Permalink
- Report Inappropriate Content
Line Chart set analysis qualifier bug?
Hi all
I am not sure if this is a bug or if I have not used the correct syntax, so hoping someone can shed some light.... Here are the details:
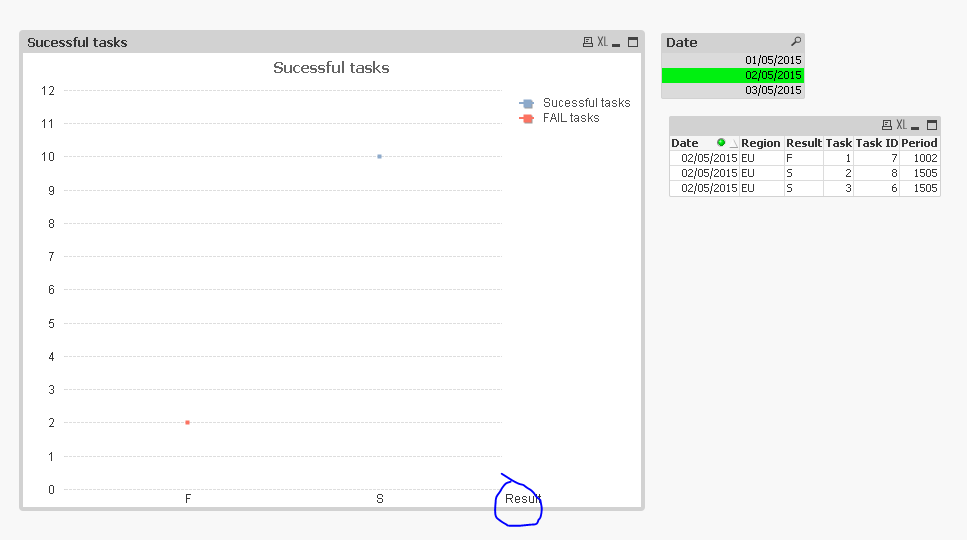
Line chart with two expressions both containing set analysis with the qualifier for "all" ,1 , used in both. The problem seems to be that the qualifier for "all" is ignored.. .So when a selection is made that has an impact on the chart. However when I disable one of the expressions the chart acts as expected i.e not subject to the selections made.
Interesting though is when I changed the chart type to a Bar chart there is no problem....
Here are the two expressions:
=Count({1 < Result={'S'} >} [Task ID])
=Count({1 < Result={'F'} > } [Task ID])
I have attached an example QVW which illustrates the point made above.
Is this a bug for the line chart???
Thanks
Scott
- Mark as New
- Bookmark
- Subscribe
- Mute
- Subscribe to RSS Feed
- Permalink
- Report Inappropriate Content
I think for line chart you can have 2 dimensions and 1 expression or 1 dimension and 2 expressions. In your case, you have two dimensions and two expressions. Have you noticed the dimension changing from date to result on selection of a date? I don't think its not a bug, it is how QlikView seems to work.
- Mark as New
- Bookmark
- Subscribe
- Mute
- Subscribe to RSS Feed
- Permalink
- Report Inappropriate Content
Hi Sunny
I think you may be spot on... when I removed the 2nd dimension the issue did not persist. It does seem that it is a case of one dimension, with two expressions. With a selection made and two dimensions in the chart the dimension does change from date to result.