Unlock a world of possibilities! Login now and discover the exclusive benefits awaiting you.
- Qlik Community
- :
- All Forums
- :
- QlikView App Dev
- :
- Line Chart value changes on selection
- Subscribe to RSS Feed
- Mark Topic as New
- Mark Topic as Read
- Float this Topic for Current User
- Bookmark
- Subscribe
- Mute
- Printer Friendly Page
- Mark as New
- Bookmark
- Subscribe
- Mute
- Subscribe to RSS Feed
- Permalink
- Report Inappropriate Content
Line Chart value changes on selection
Hi Experts,
I have created a line chart with month as dimension and used aggr() function in expression.
The line chart is giving the correct value but it changes on selection of month and showing wrong value.
Regards,
Anjali Gupta
- Mark as New
- Bookmark
- Subscribe
- Mute
- Subscribe to RSS Feed
- Permalink
- Report Inappropriate Content
Hi,
Is it possible to supply some more information or a sample Qvw?
What is the expression?
What are you seeing?
What are you expecting to see?
Mark
- Mark as New
- Bookmark
- Subscribe
- Mute
- Subscribe to RSS Feed
- Permalink
- Report Inappropriate Content
Hi Anjali ,
can u share what wrong values your are getting detail
- Mark as New
- Bookmark
- Subscribe
- Mute
- Subscribe to RSS Feed
- Permalink
- Report Inappropriate Content
Hi Mark,
Before any selection the line chart has the value :
May : 100.00%
Sep : 99.95%
Oct : 99.97%
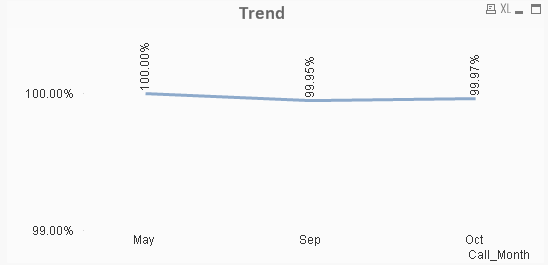
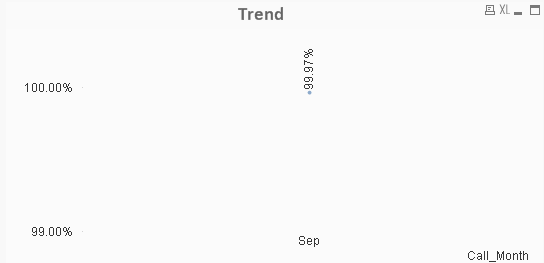
whereas on selecting the month as Sep the value of Sep changes from 99.95% to 99.97%
Below is the image:
Expression Used:
=Avg(Aggr(
Num( 1-(Num(sum(field1))
/(Interval(MonthEnd( [Year-Month]))-MonthStart(min([Year-Month])),'mm'))),'##.###%'))
,Field2))
Due to some restriction I can't share the field1's and field2's exact name.