Unlock a world of possibilities! Login now and discover the exclusive benefits awaiting you.
- Qlik Community
- :
- All Forums
- :
- QlikView App Dev
- :
- Re: Line Diagraph - Selection
- Subscribe to RSS Feed
- Mark Topic as New
- Mark Topic as Read
- Float this Topic for Current User
- Bookmark
- Subscribe
- Mute
- Printer Friendly Page
- Mark as New
- Bookmark
- Subscribe
- Mute
- Subscribe to RSS Feed
- Permalink
- Report Inappropriate Content
Line Diagraph - Selection
Dear All,
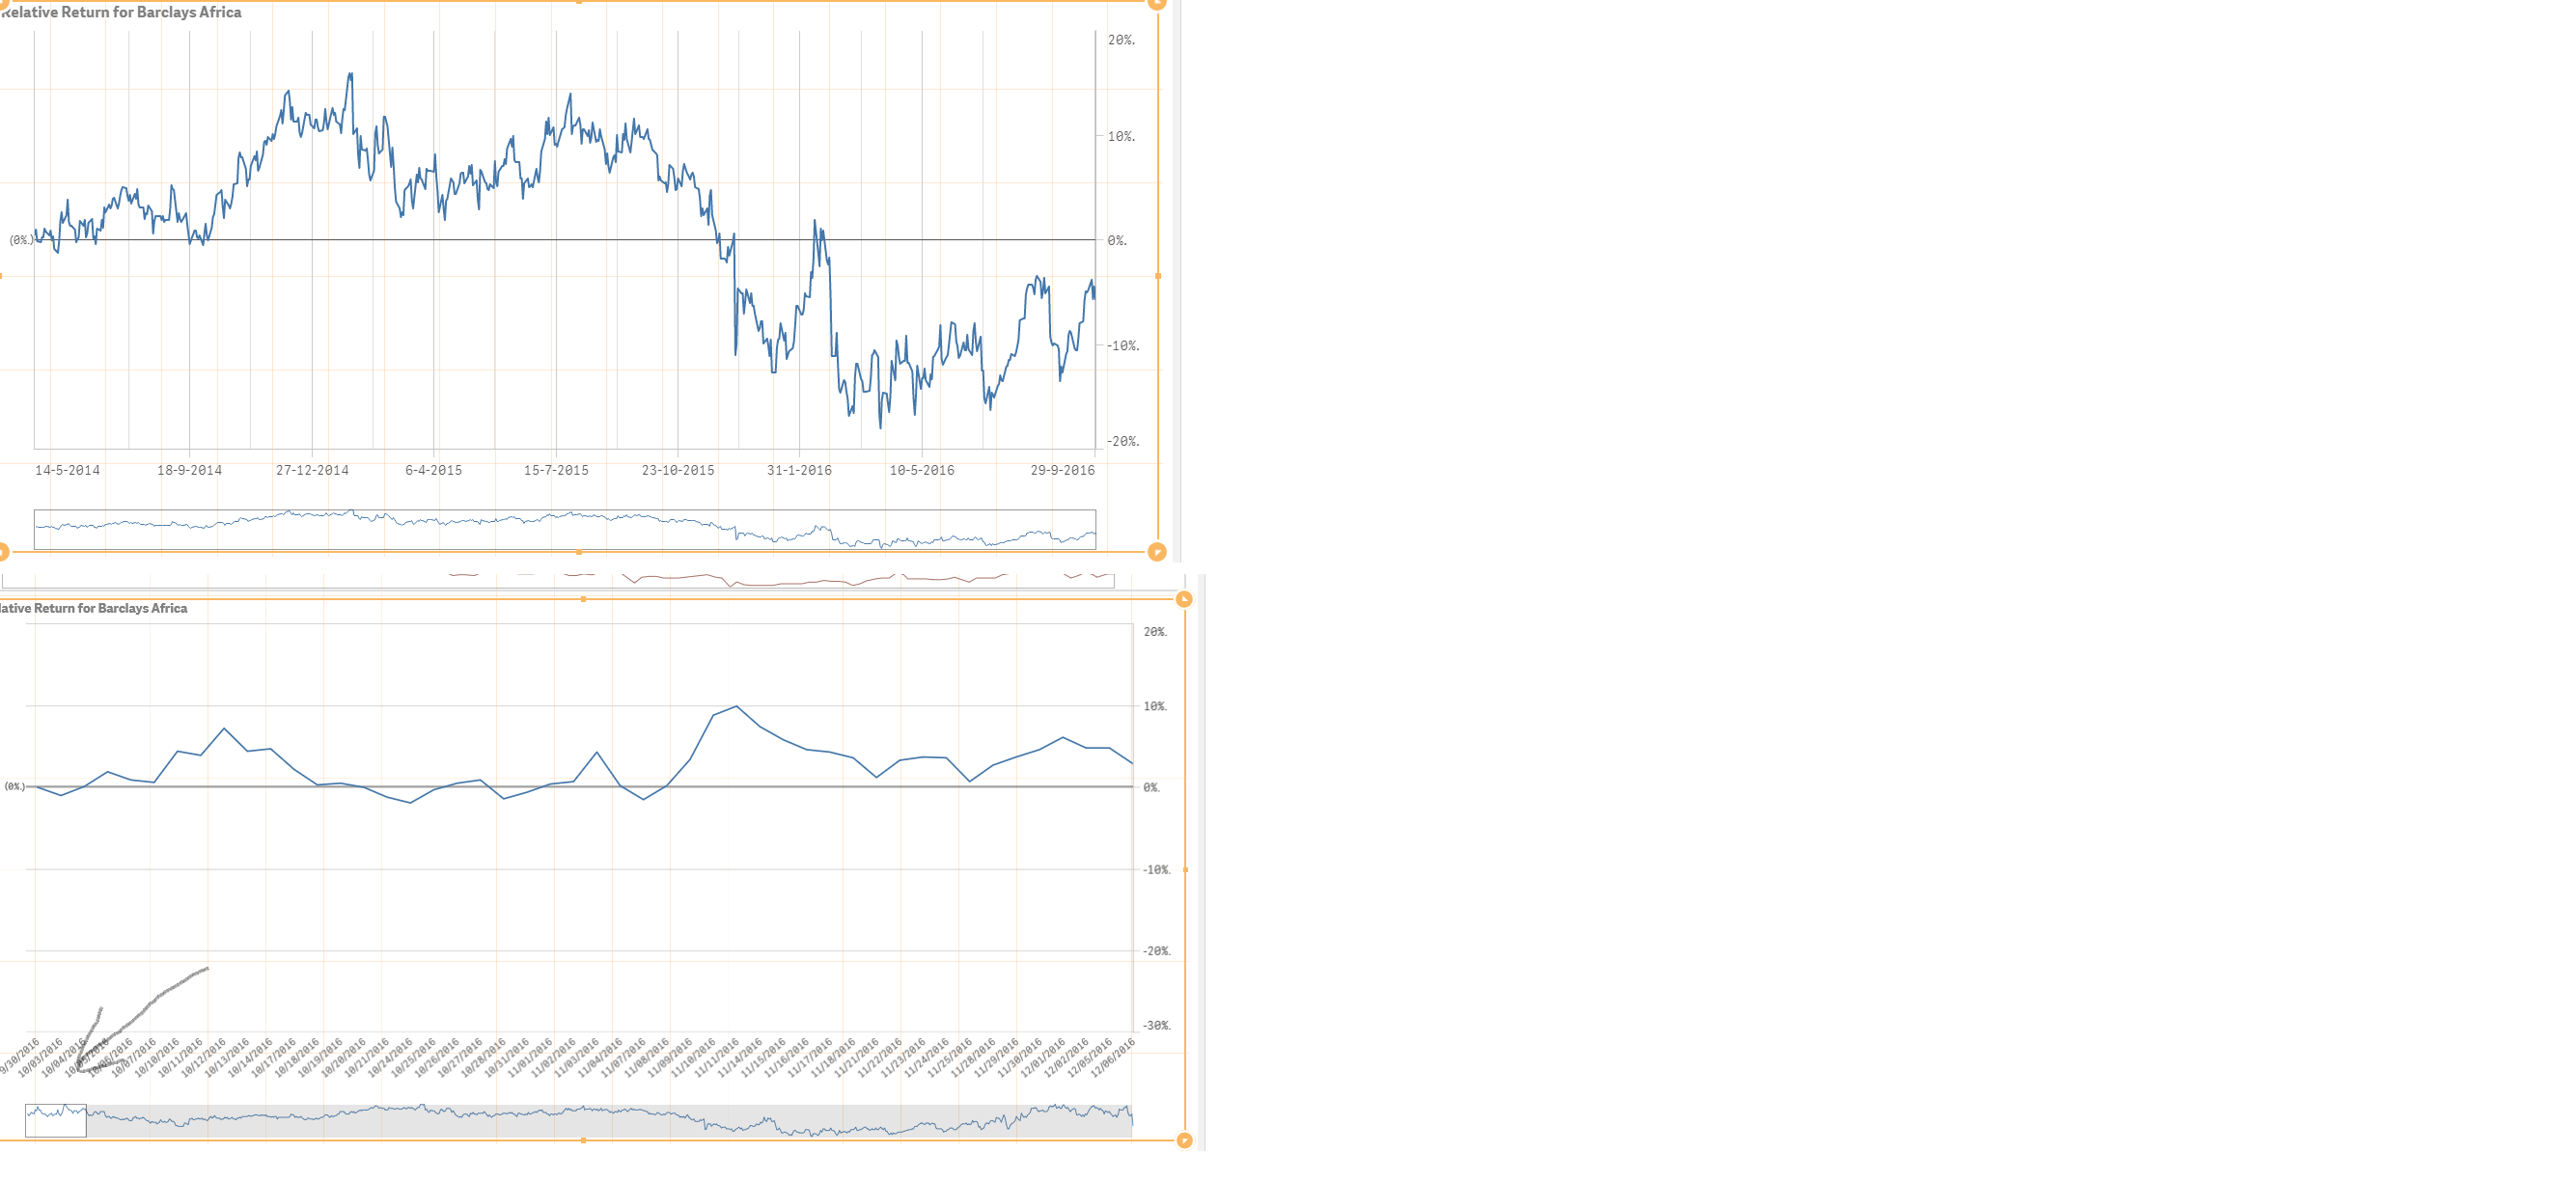
I have attached a document in which I have depicted two (identical) graphs. The upper graph has no selection (thus shows the full data set), however the lower graph shows a "selection" of the data available. I want the lower graph to be without the selection, identical to the upper graph. Can anybody advice on how to switch off the selection?
Many thanks in advance for your help.
Rgds,
Sandeep
- Mark as New
- Bookmark
- Subscribe
- Mute
- Subscribe to RSS Feed
- Permalink
- Report Inappropriate Content
Hi Sandeep,
Is it possible to reduce the number of values on the axis X of the chart when loading data in the script?
Regards,
Andrey
- Mark as New
- Bookmark
- Subscribe
- Mute
- Subscribe to RSS Feed
- Permalink
- Report Inappropriate Content
Hi Sandeep, seems that the upper chart has continous axis for x axis, which allows for zooming in the chart, while the second doesn't have a continous axis, so the zoom is fixed and you have to drag the visible area.
This option is set in the "layout?" section (freely translated, the last option on the right menu)
- Mark as New
- Bookmark
- Subscribe
- Mute
- Subscribe to RSS Feed
- Permalink
- Report Inappropriate Content
Hi Ruben,
Thanks for your suggestions. I looked into this before, however for the second graph this option does not seem to be available for the second chart ( I cant figure out why, its the same data).
See attachement. Any idea on how to solve for this?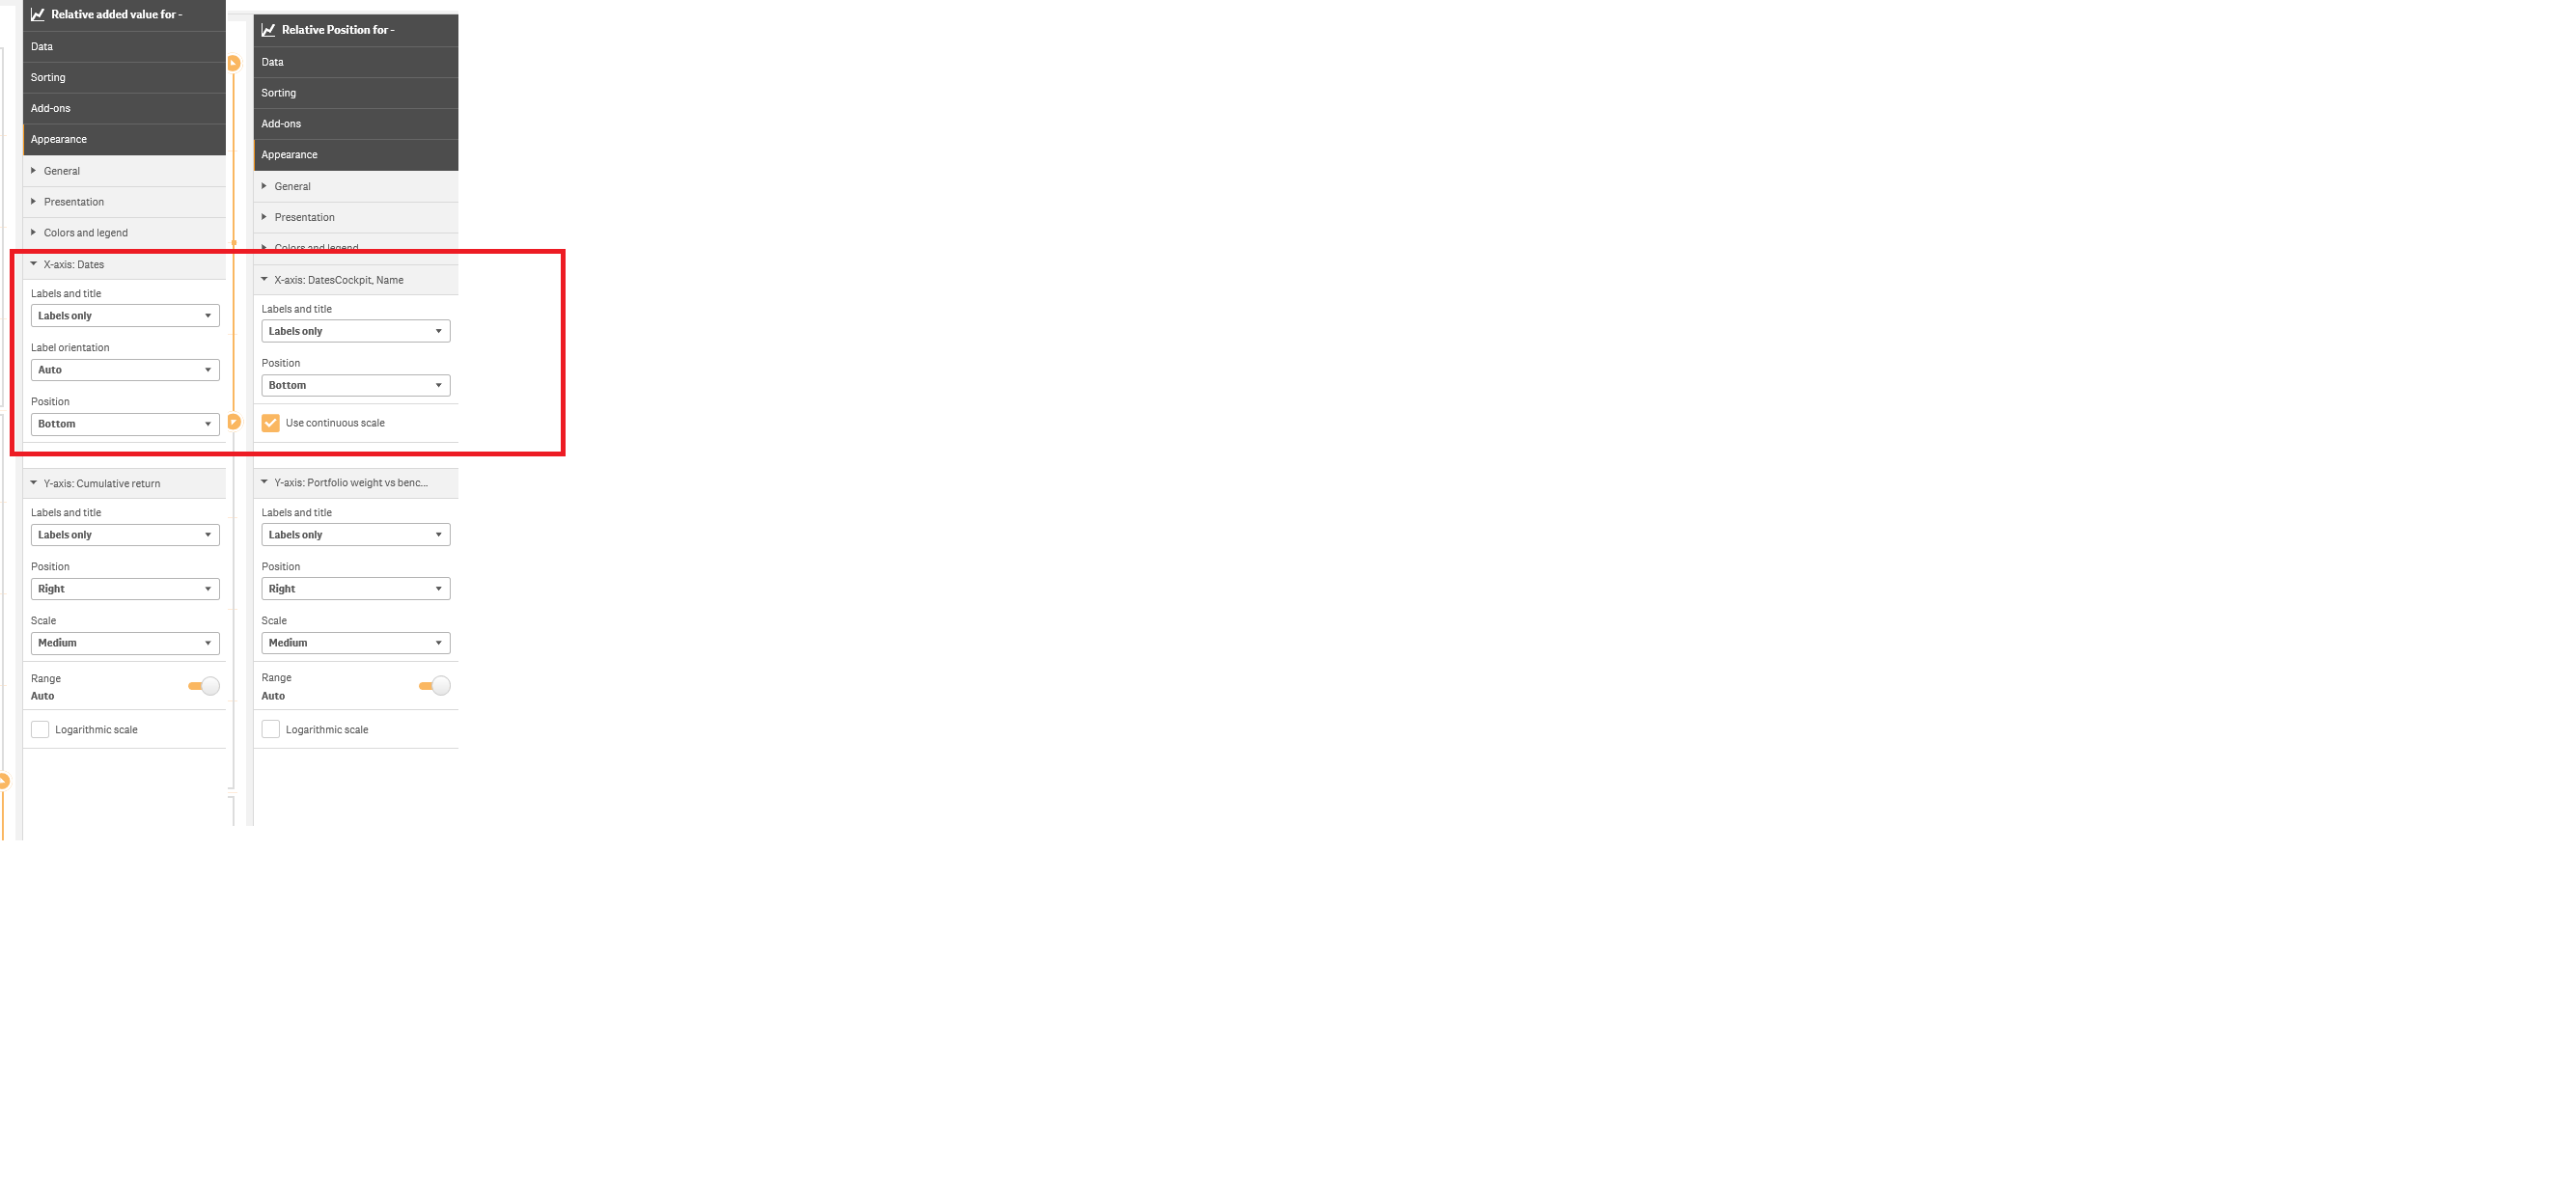
- Mark as New
- Bookmark
- Subscribe
- Mute
- Subscribe to RSS Feed
- Permalink
- Report Inappropriate Content
Hi Andrey, both graphs use the same data. This should not be the issue right?