Unlock a world of possibilities! Login now and discover the exclusive benefits awaiting you.
- Qlik Community
- :
- All Forums
- :
- QlikView App Dev
- :
- Line Plot on Graph
- Subscribe to RSS Feed
- Mark Topic as New
- Mark Topic as Read
- Float this Topic for Current User
- Bookmark
- Subscribe
- Mute
- Printer Friendly Page
- Mark as New
- Bookmark
- Subscribe
- Mute
- Subscribe to RSS Feed
- Permalink
- Report Inappropriate Content
Line Plot on Graph
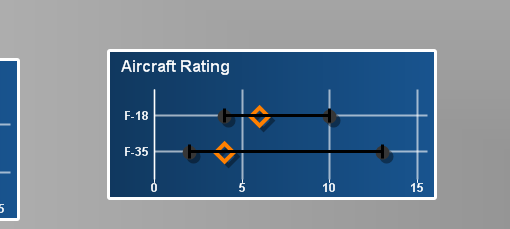
I am trying to connect the minimum and maximum plot points on this graph. I did it with a bar on a bar chart but it does not resize appropriately. Any idea on how just to make a line connect the two points?
- « Previous Replies
-
- 1
- 2
- Next Replies »
- Mark as New
- Bookmark
- Subscribe
- Mute
- Subscribe to RSS Feed
- Permalink
- Report Inappropriate Content
Not sure what you want, would you mind posting an image of what you need?
- Mark as New
- Bookmark
- Subscribe
- Mute
- Subscribe to RSS Feed
- Permalink
- Report Inappropriate Content
I posted the Qlik document. It has one example where the two data points are connected with a bar but I want a better solution if resized.
- Mark as New
- Bookmark
- Subscribe
- Mute
- Subscribe to RSS Feed
- Permalink
- Report Inappropriate Content
In the left chart,
- Disable/Delete the fourth expression.
- Enter 'MinRad' in the expression for Bar Offset (expand the expression tree for MaxRad - MinRad)
I don't understand why you say that the current solution doesn't "resize correctly". What do you mean exactly?
- Mark as New
- Bookmark
- Subscribe
- Mute
- Subscribe to RSS Feed
- Permalink
- Report Inappropriate Content
When you resize the chart the bar gets bigger. I want it to stay the same size. If I could some how connect the two dots that would be best.
- Mark as New
- Bookmark
- Subscribe
- Mute
- Subscribe to RSS Feed
- Permalink
- Report Inappropriate Content
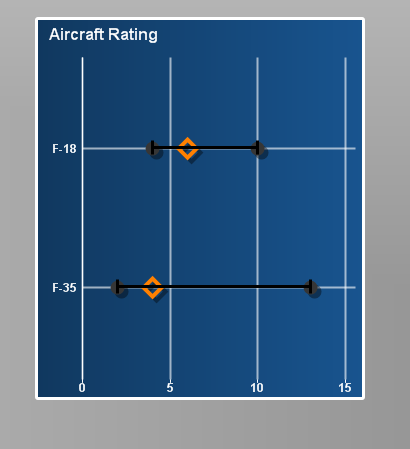
Maybe using Error Bars?
- Mark as New
- Bookmark
- Subscribe
- Mute
- Subscribe to RSS Feed
- Permalink
- Report Inappropriate Content
This is a possibility. Can we make them thicker? Can we make them appear behind the icons? Also how did you do it?
- Mark as New
- Bookmark
- Subscribe
- Mute
- Subscribe to RSS Feed
- Permalink
- Report Inappropriate Content
- Go to Expressions and Select the 3rd one
- Check "Has Errors Bars" it would enable Error Above and Error Below for "curr" expression
- Go to Presentation Tab and "play" with "Error Bars" group
- Not sure about how to make them appear behind the icons
I´ve attached my qvw, did you check it?
- Mark as New
- Bookmark
- Subscribe
- Mute
- Subscribe to RSS Feed
- Permalink
- Report Inappropriate Content
How does it know how long to make the bars?
- Mark as New
- Bookmark
- Subscribe
- Mute
- Subscribe to RSS Feed
- Permalink
- Report Inappropriate Content
You enter the correct expressions for each segment. (for example MaxRad - currr for the segment Above)
And I think that error bars will always be displayed on top of everything else.
- « Previous Replies
-
- 1
- 2
- Next Replies »